Exploring Energy Monitoring with ESPhome
Just a climate conscious being taking steps to reduce carbon footprint!


A few weeks after I started to record my solar plant's energy generation, It was only right to measure the consumption at home. Previously, all reading from the sensor attached to the solar plant were being pushed into a timeseries database known as InfluxDB. From there, I would put flux queries in place to create visuals and dashboards.
Just like networks have ingress and egress, net data moved is calculated on the difference of these values. I initially planned to add a sensor on each phase and push the readings into InfluxDB, but I quick realized that calculating the net consumptions with an on-grid solar system would prove to be challenging. I'll explain more on how I deviated from this path further down.
MCU & Sensor
Looking forward to Phase 4
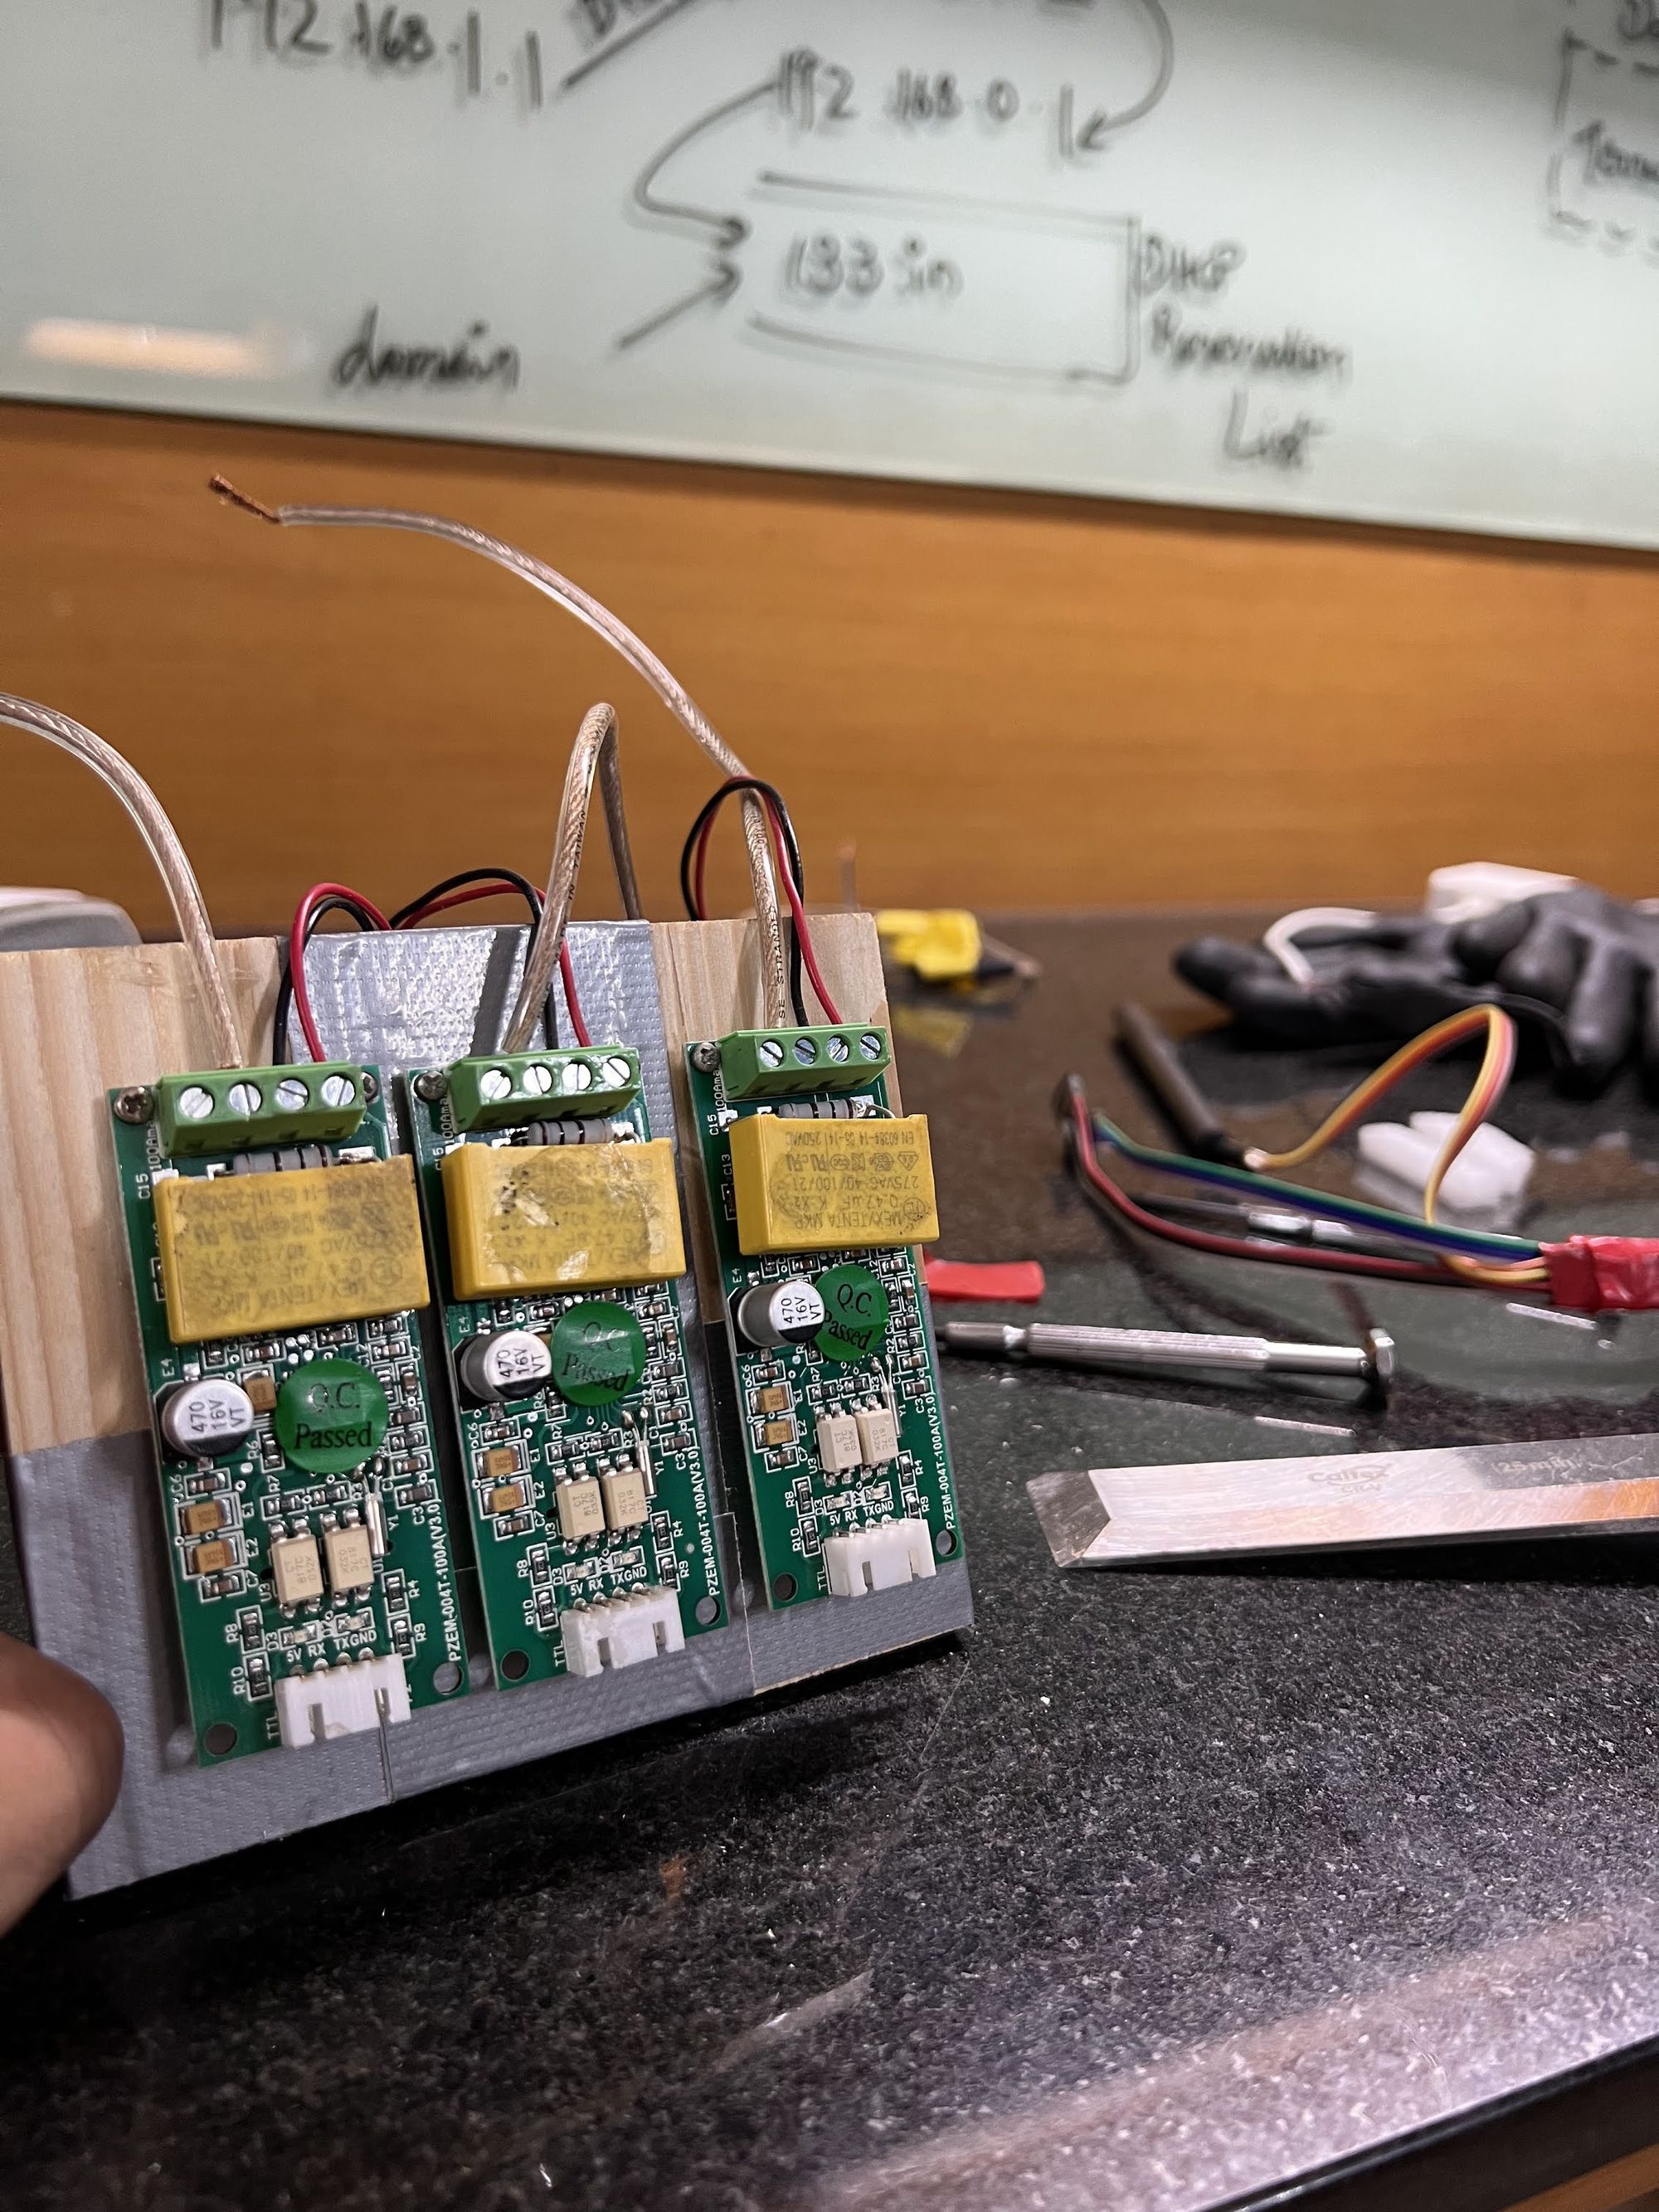
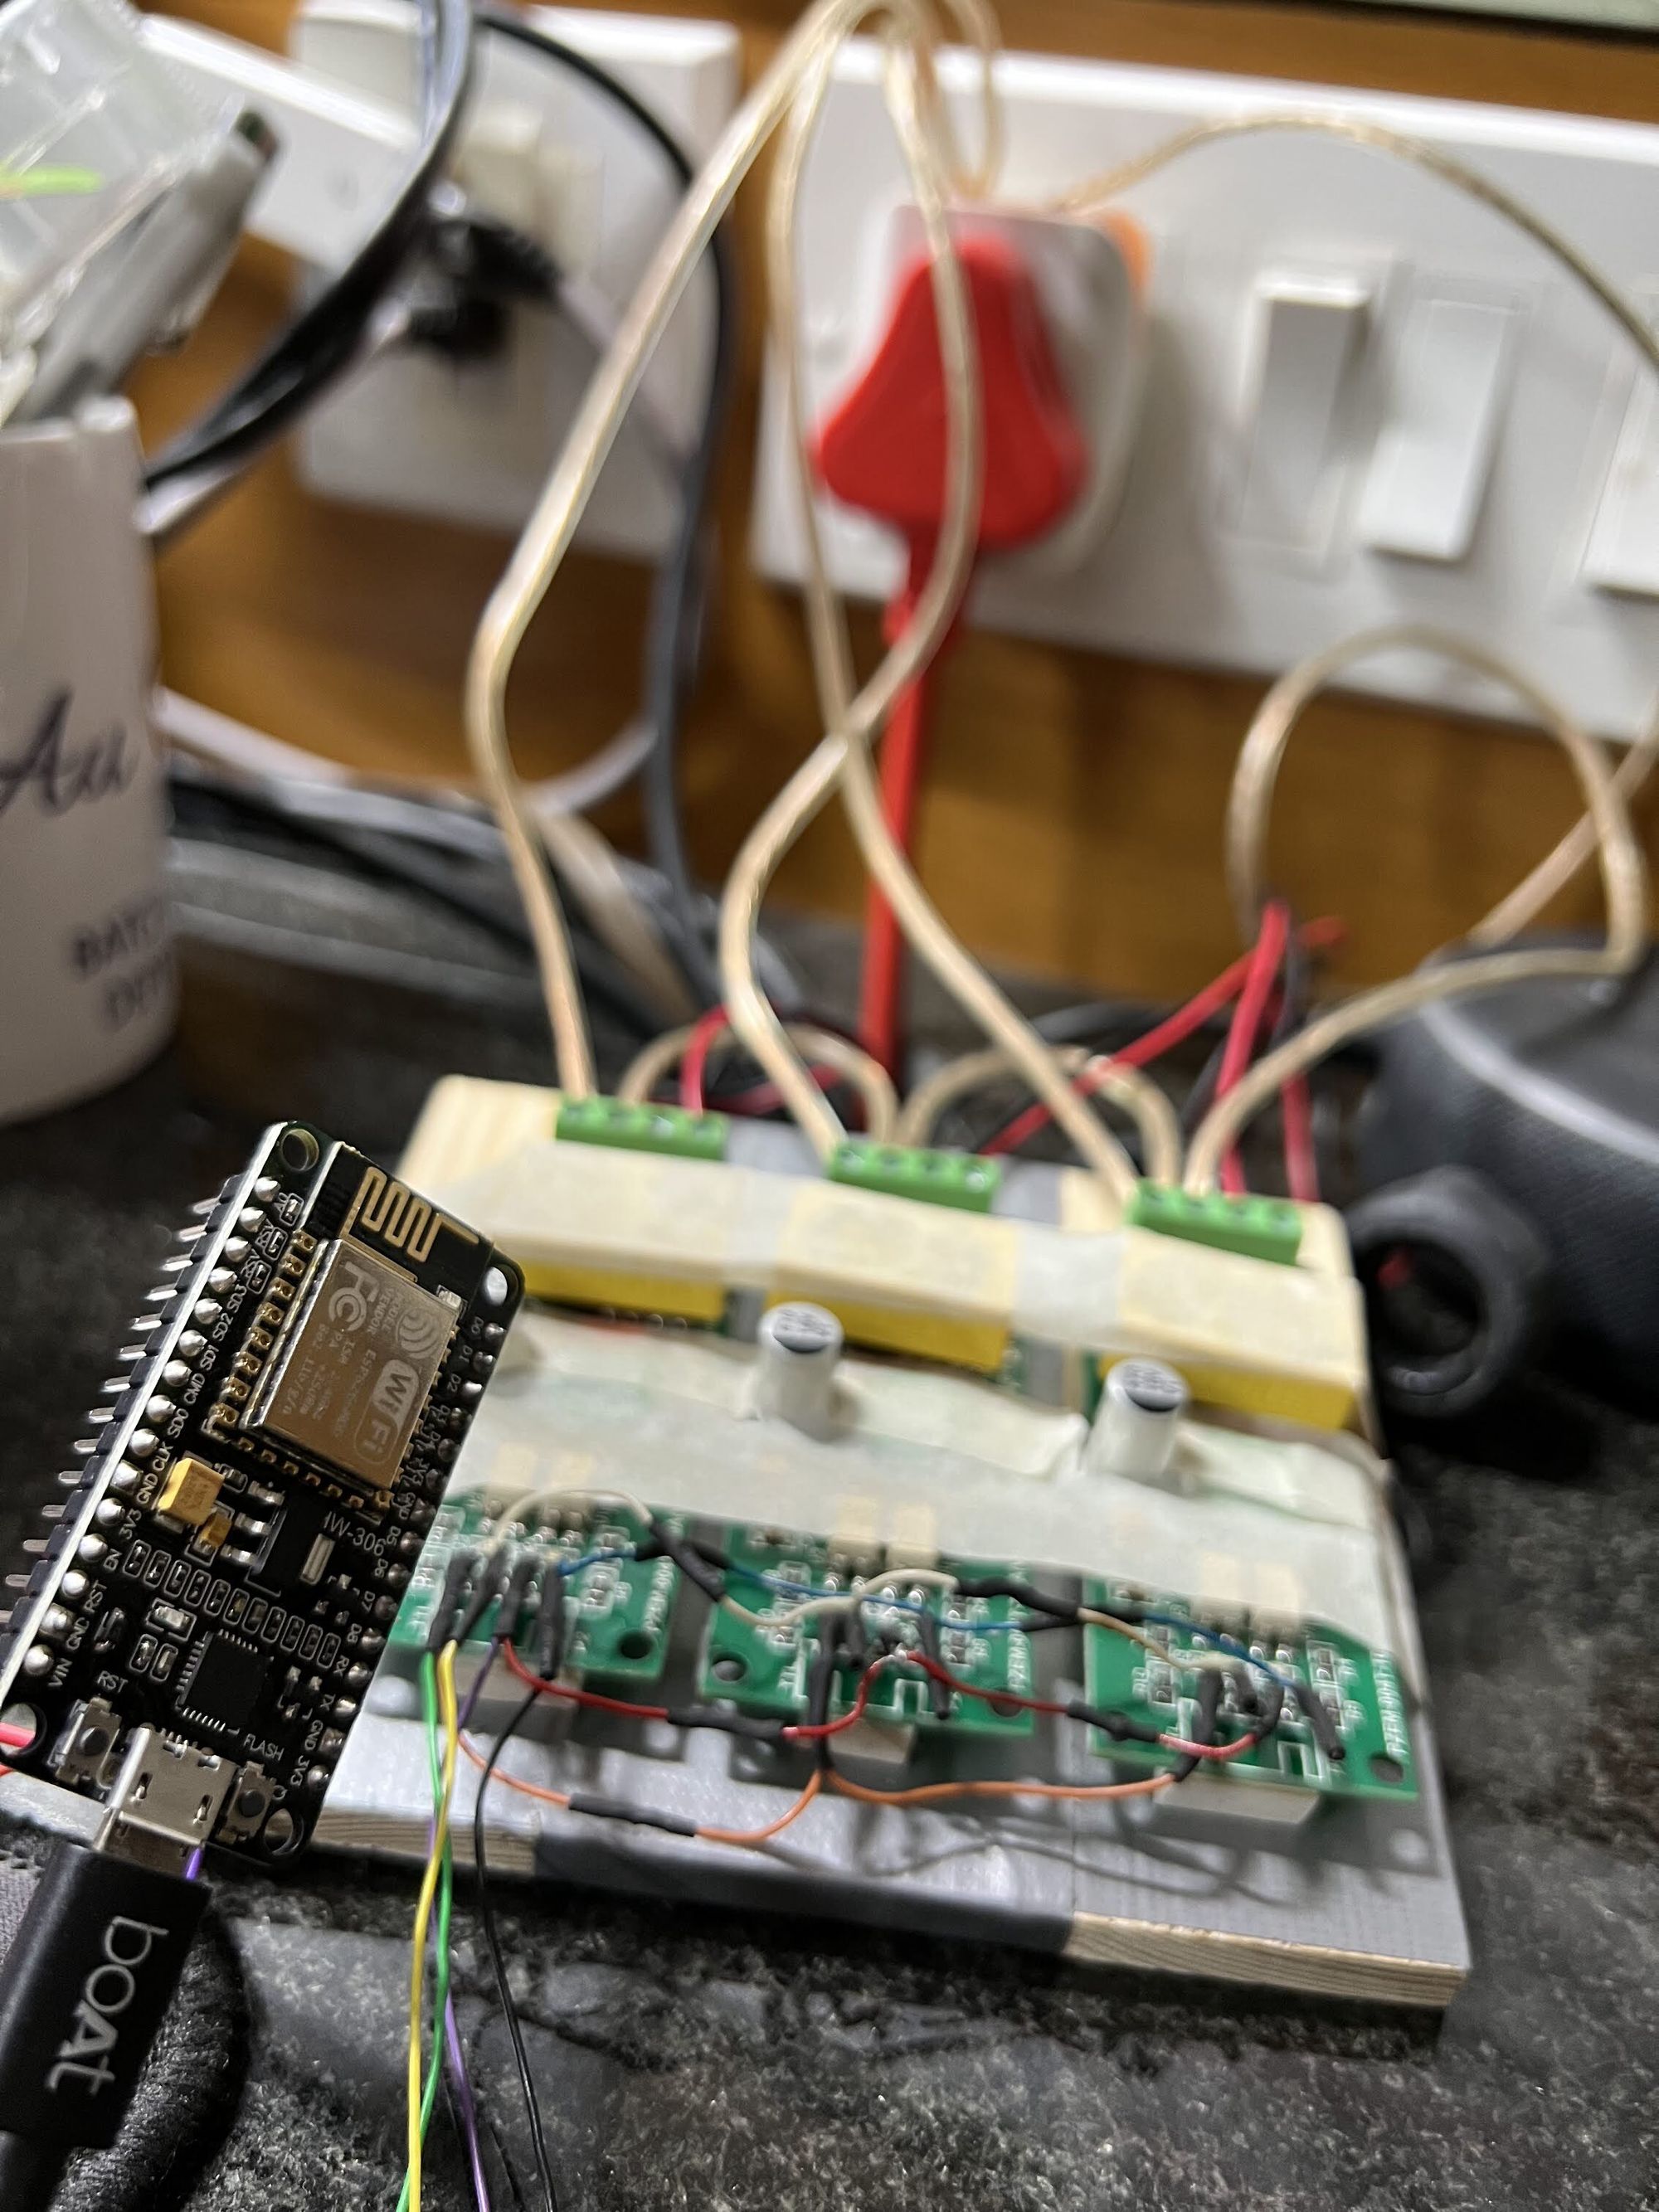
As I have worked with measuring electrical usage on a capstone project for my bachelors, I decided to use the same set of sensors. The PZEM-004T just gets the job done. It measures voltage, current, power, energy, power factor and frequency. On the microcontroller side, I chose an ESP32. Having 3 sensors on a single serial port meant I had to use Multidrop networked UART with the sensors acting as slaves.
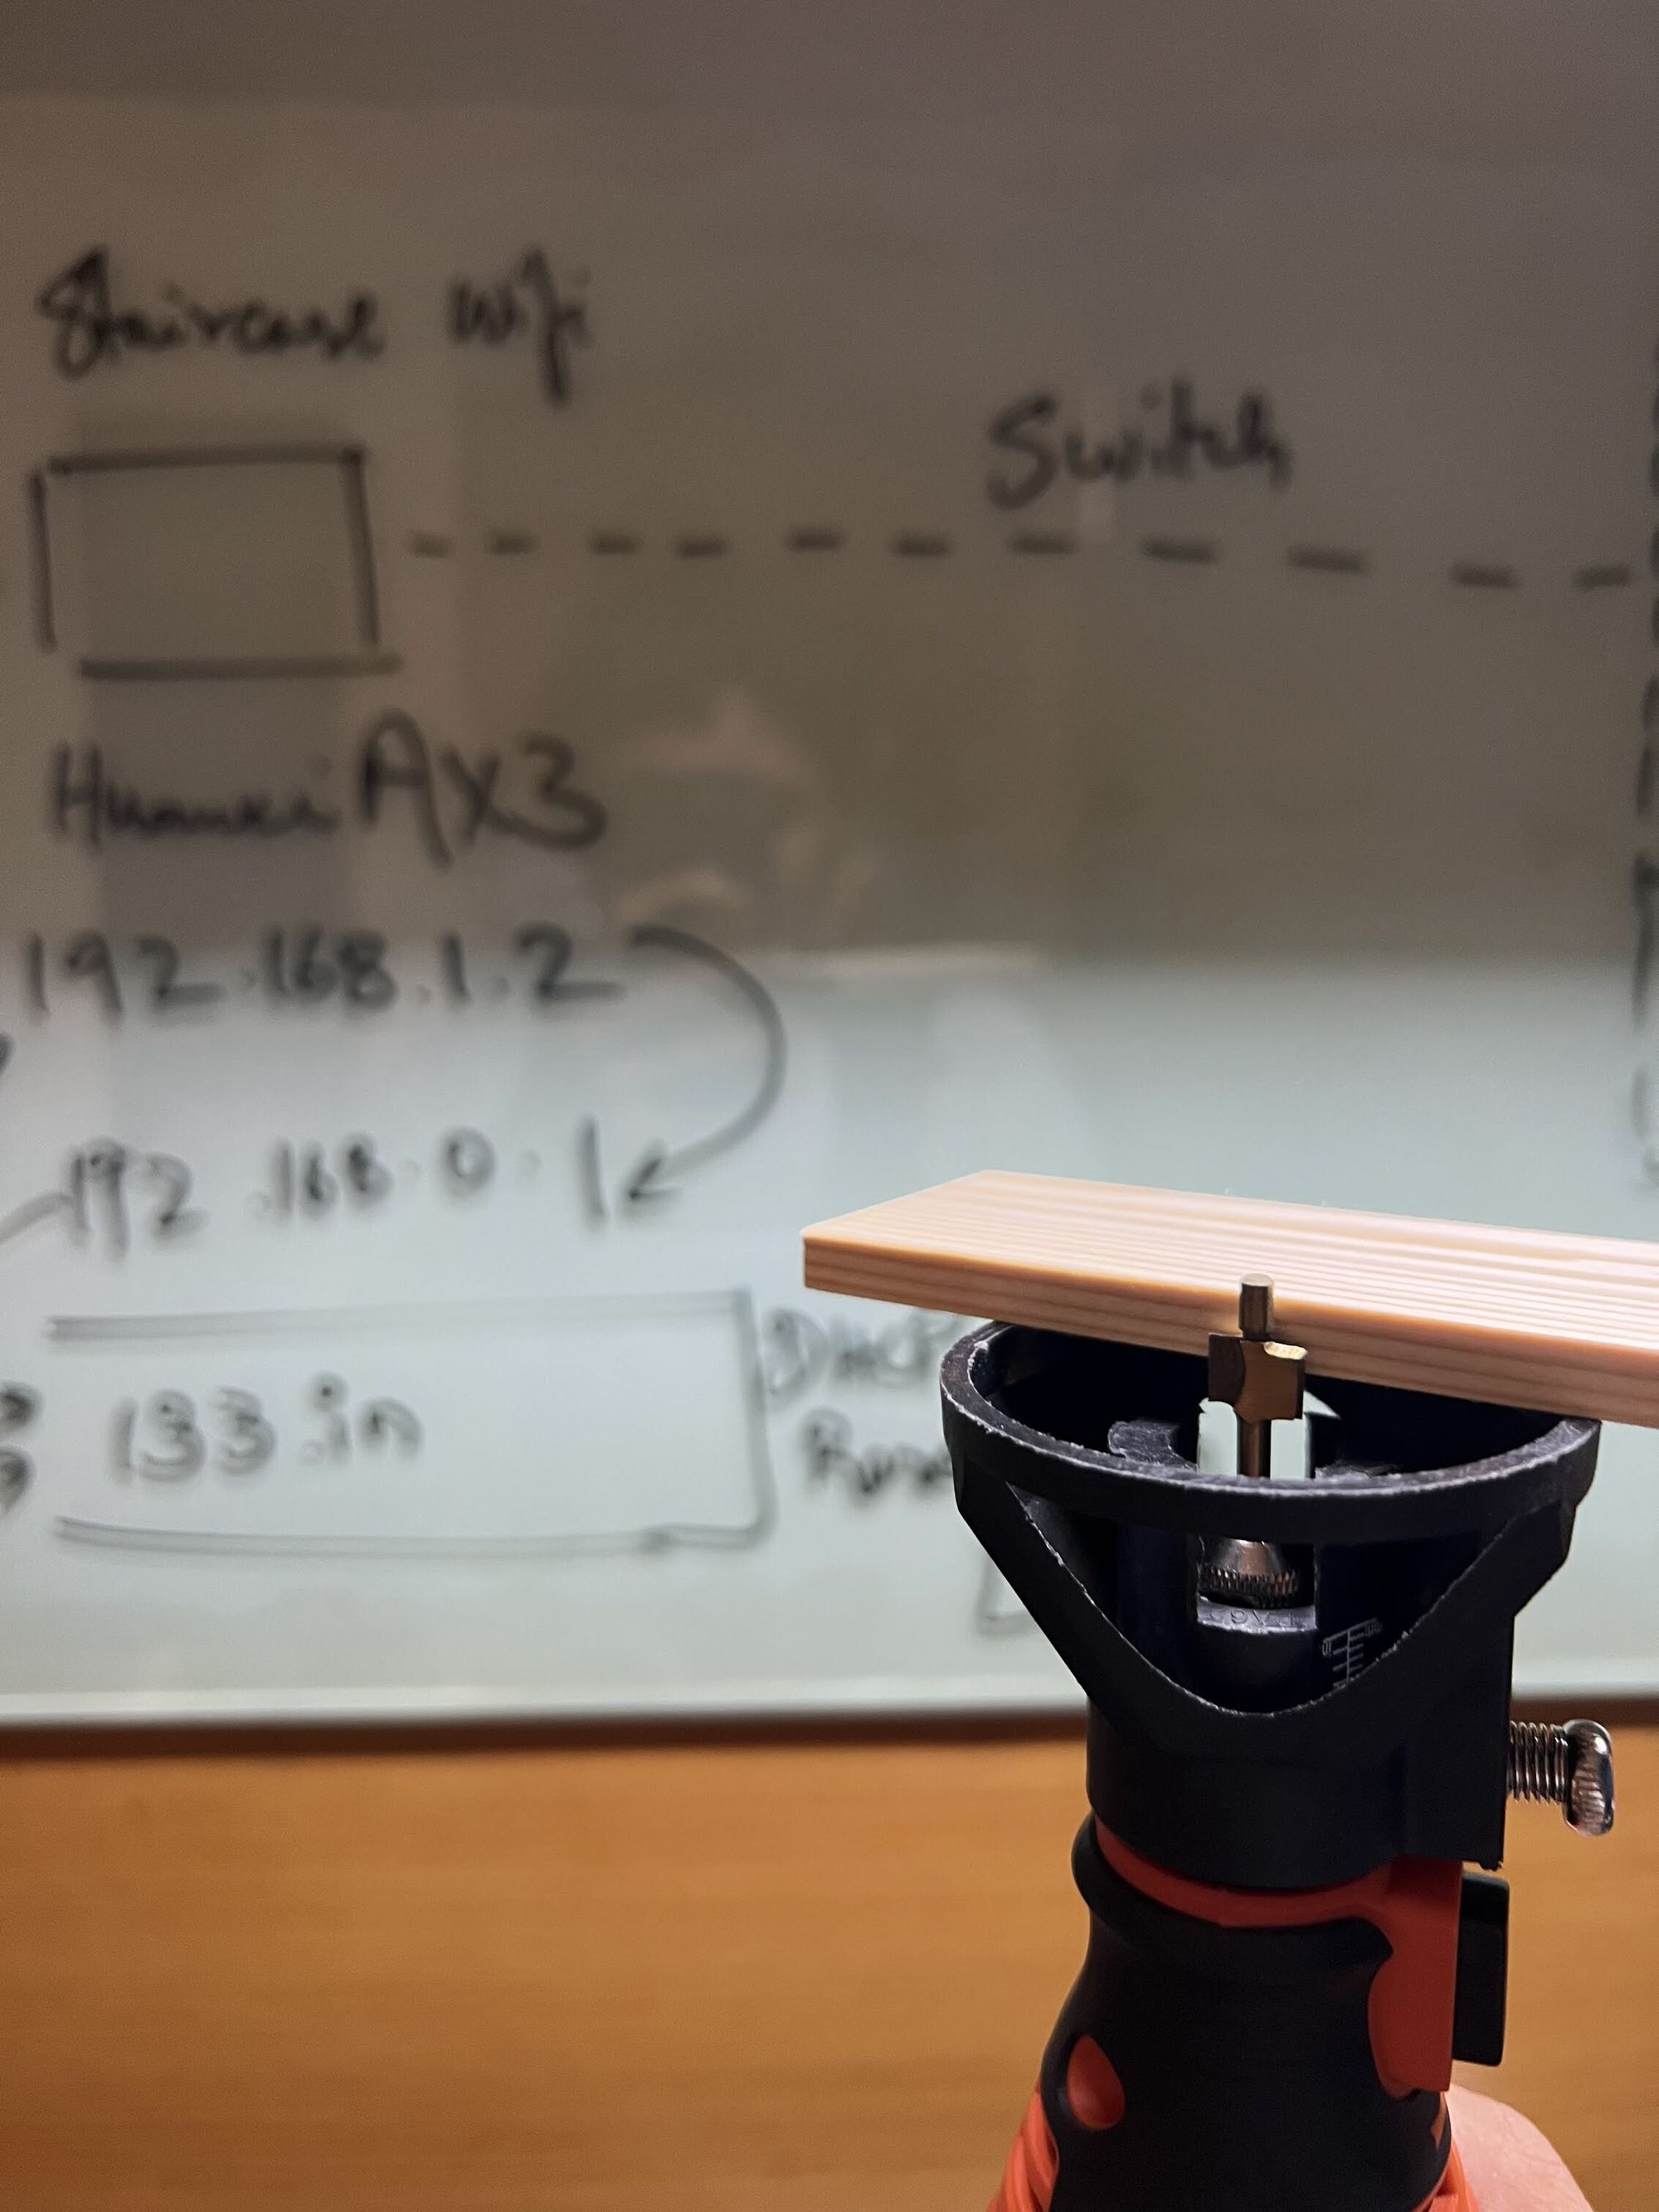
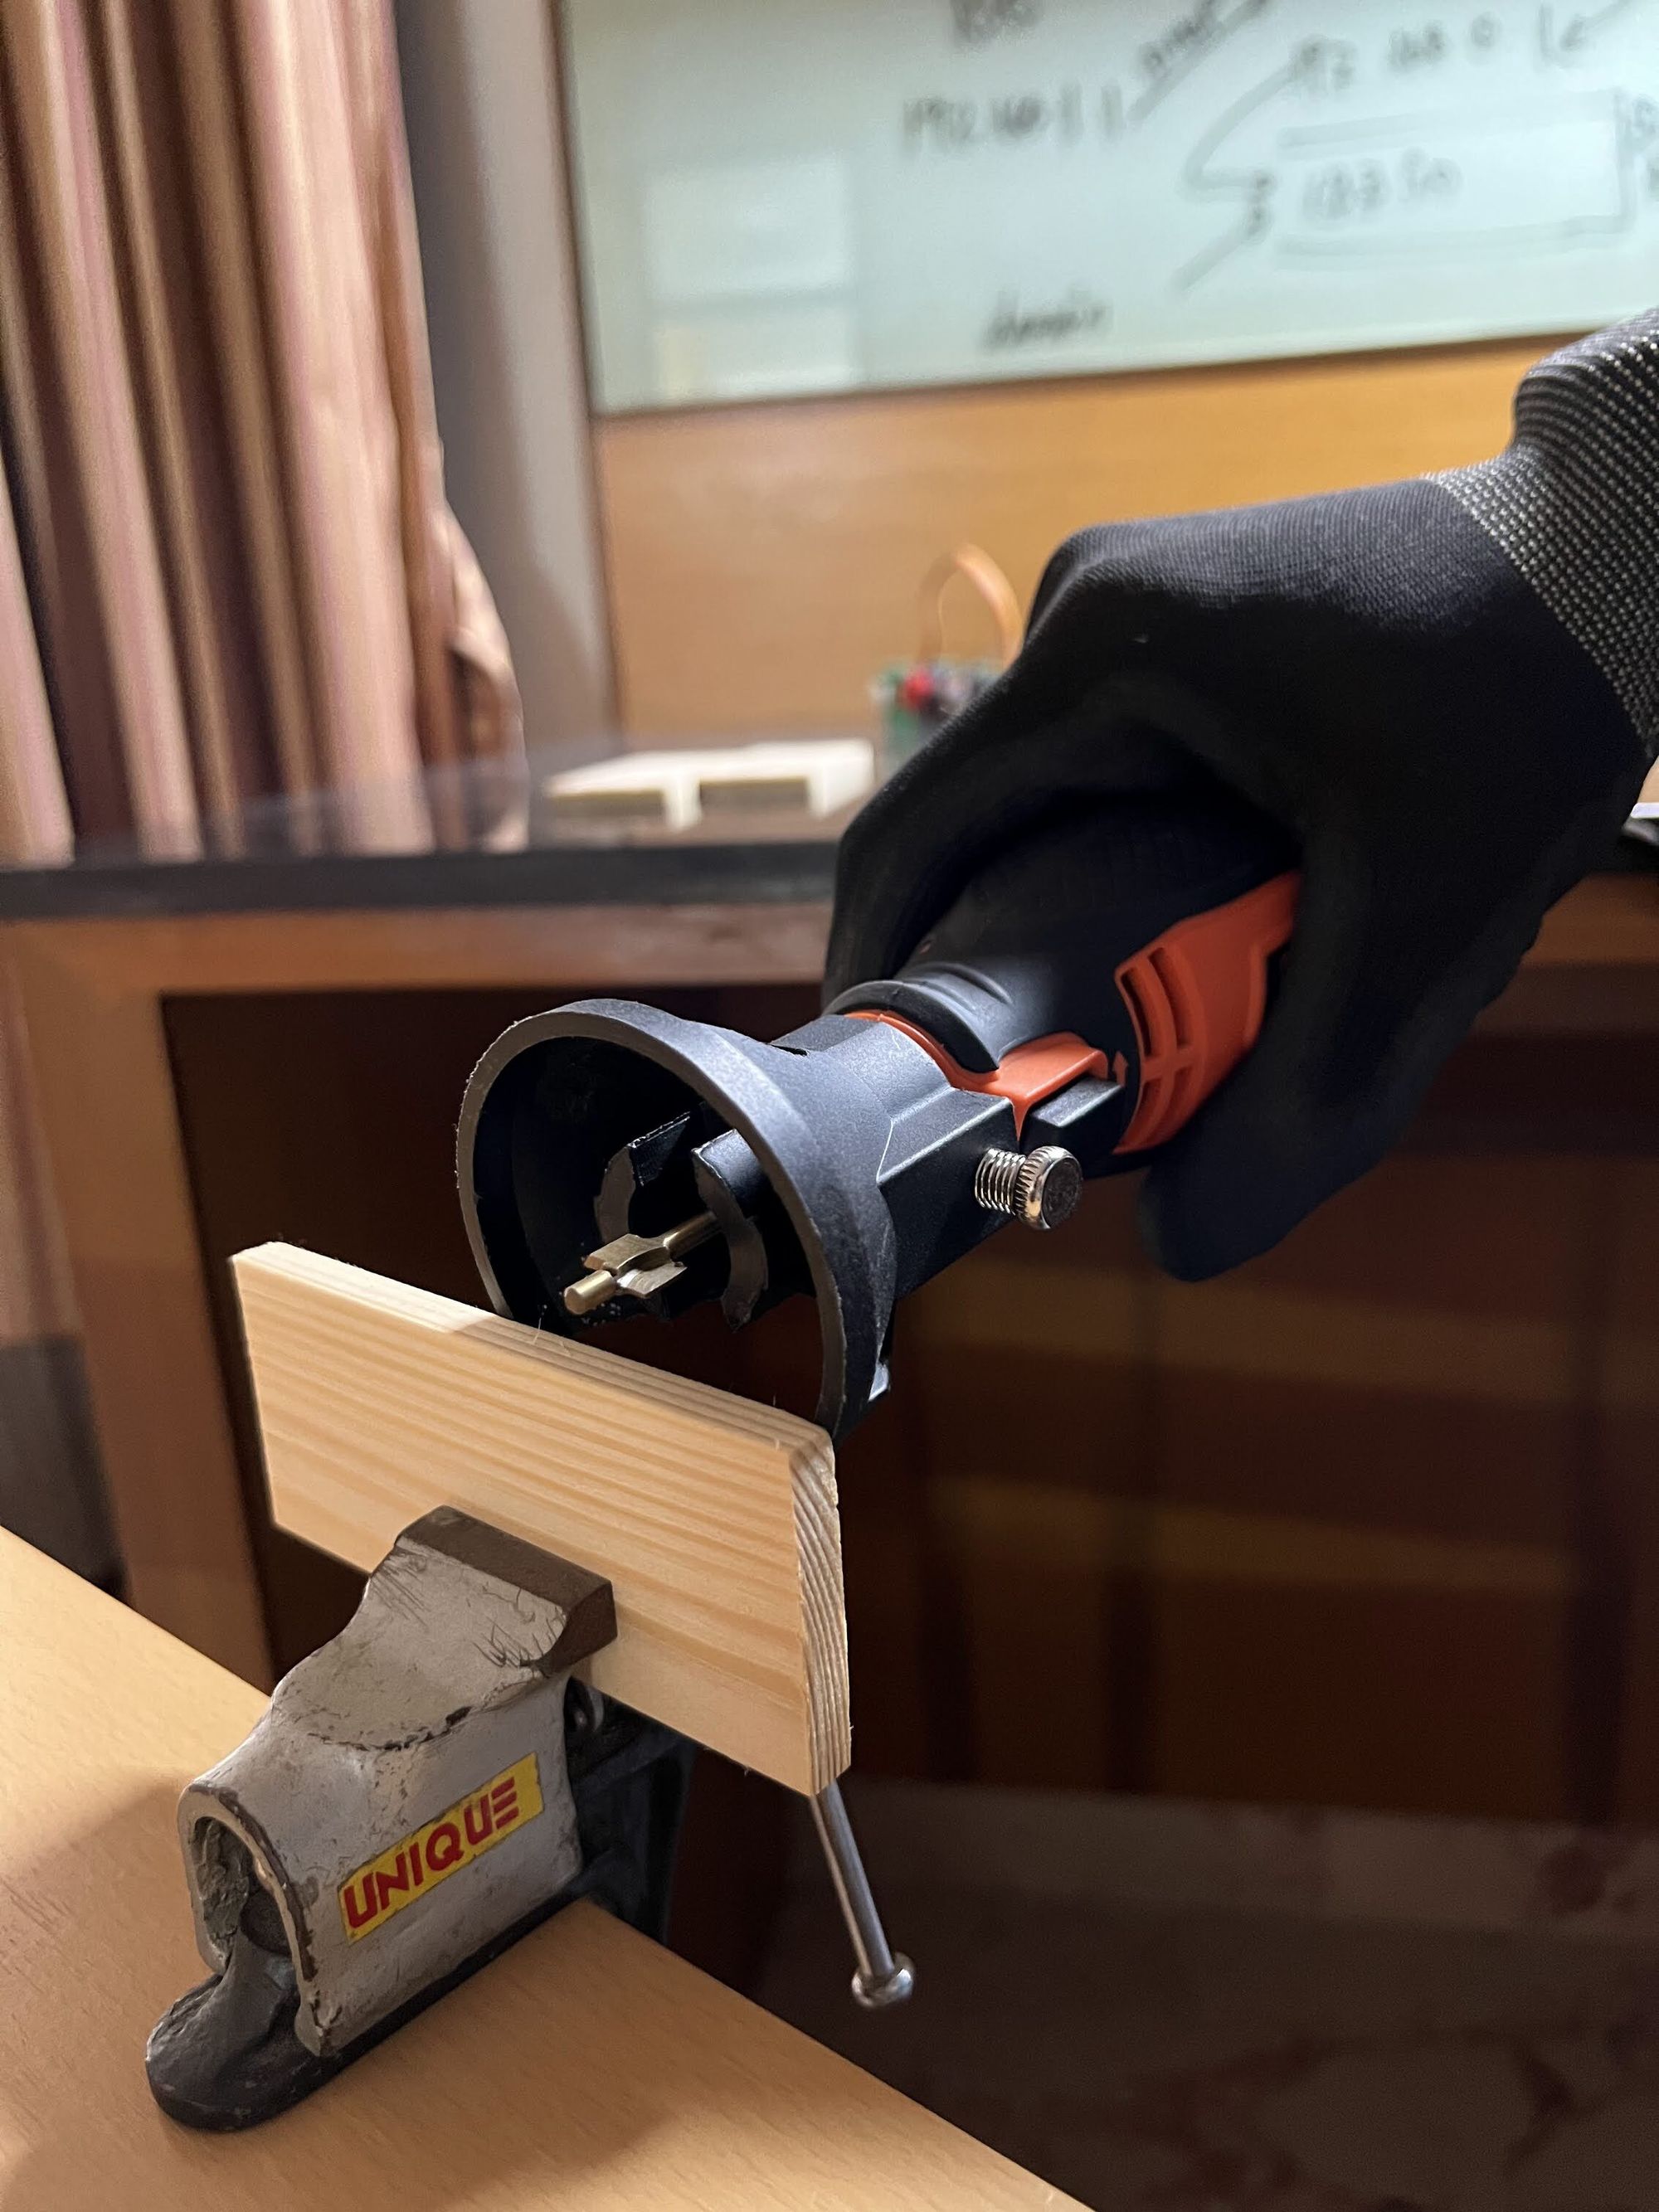
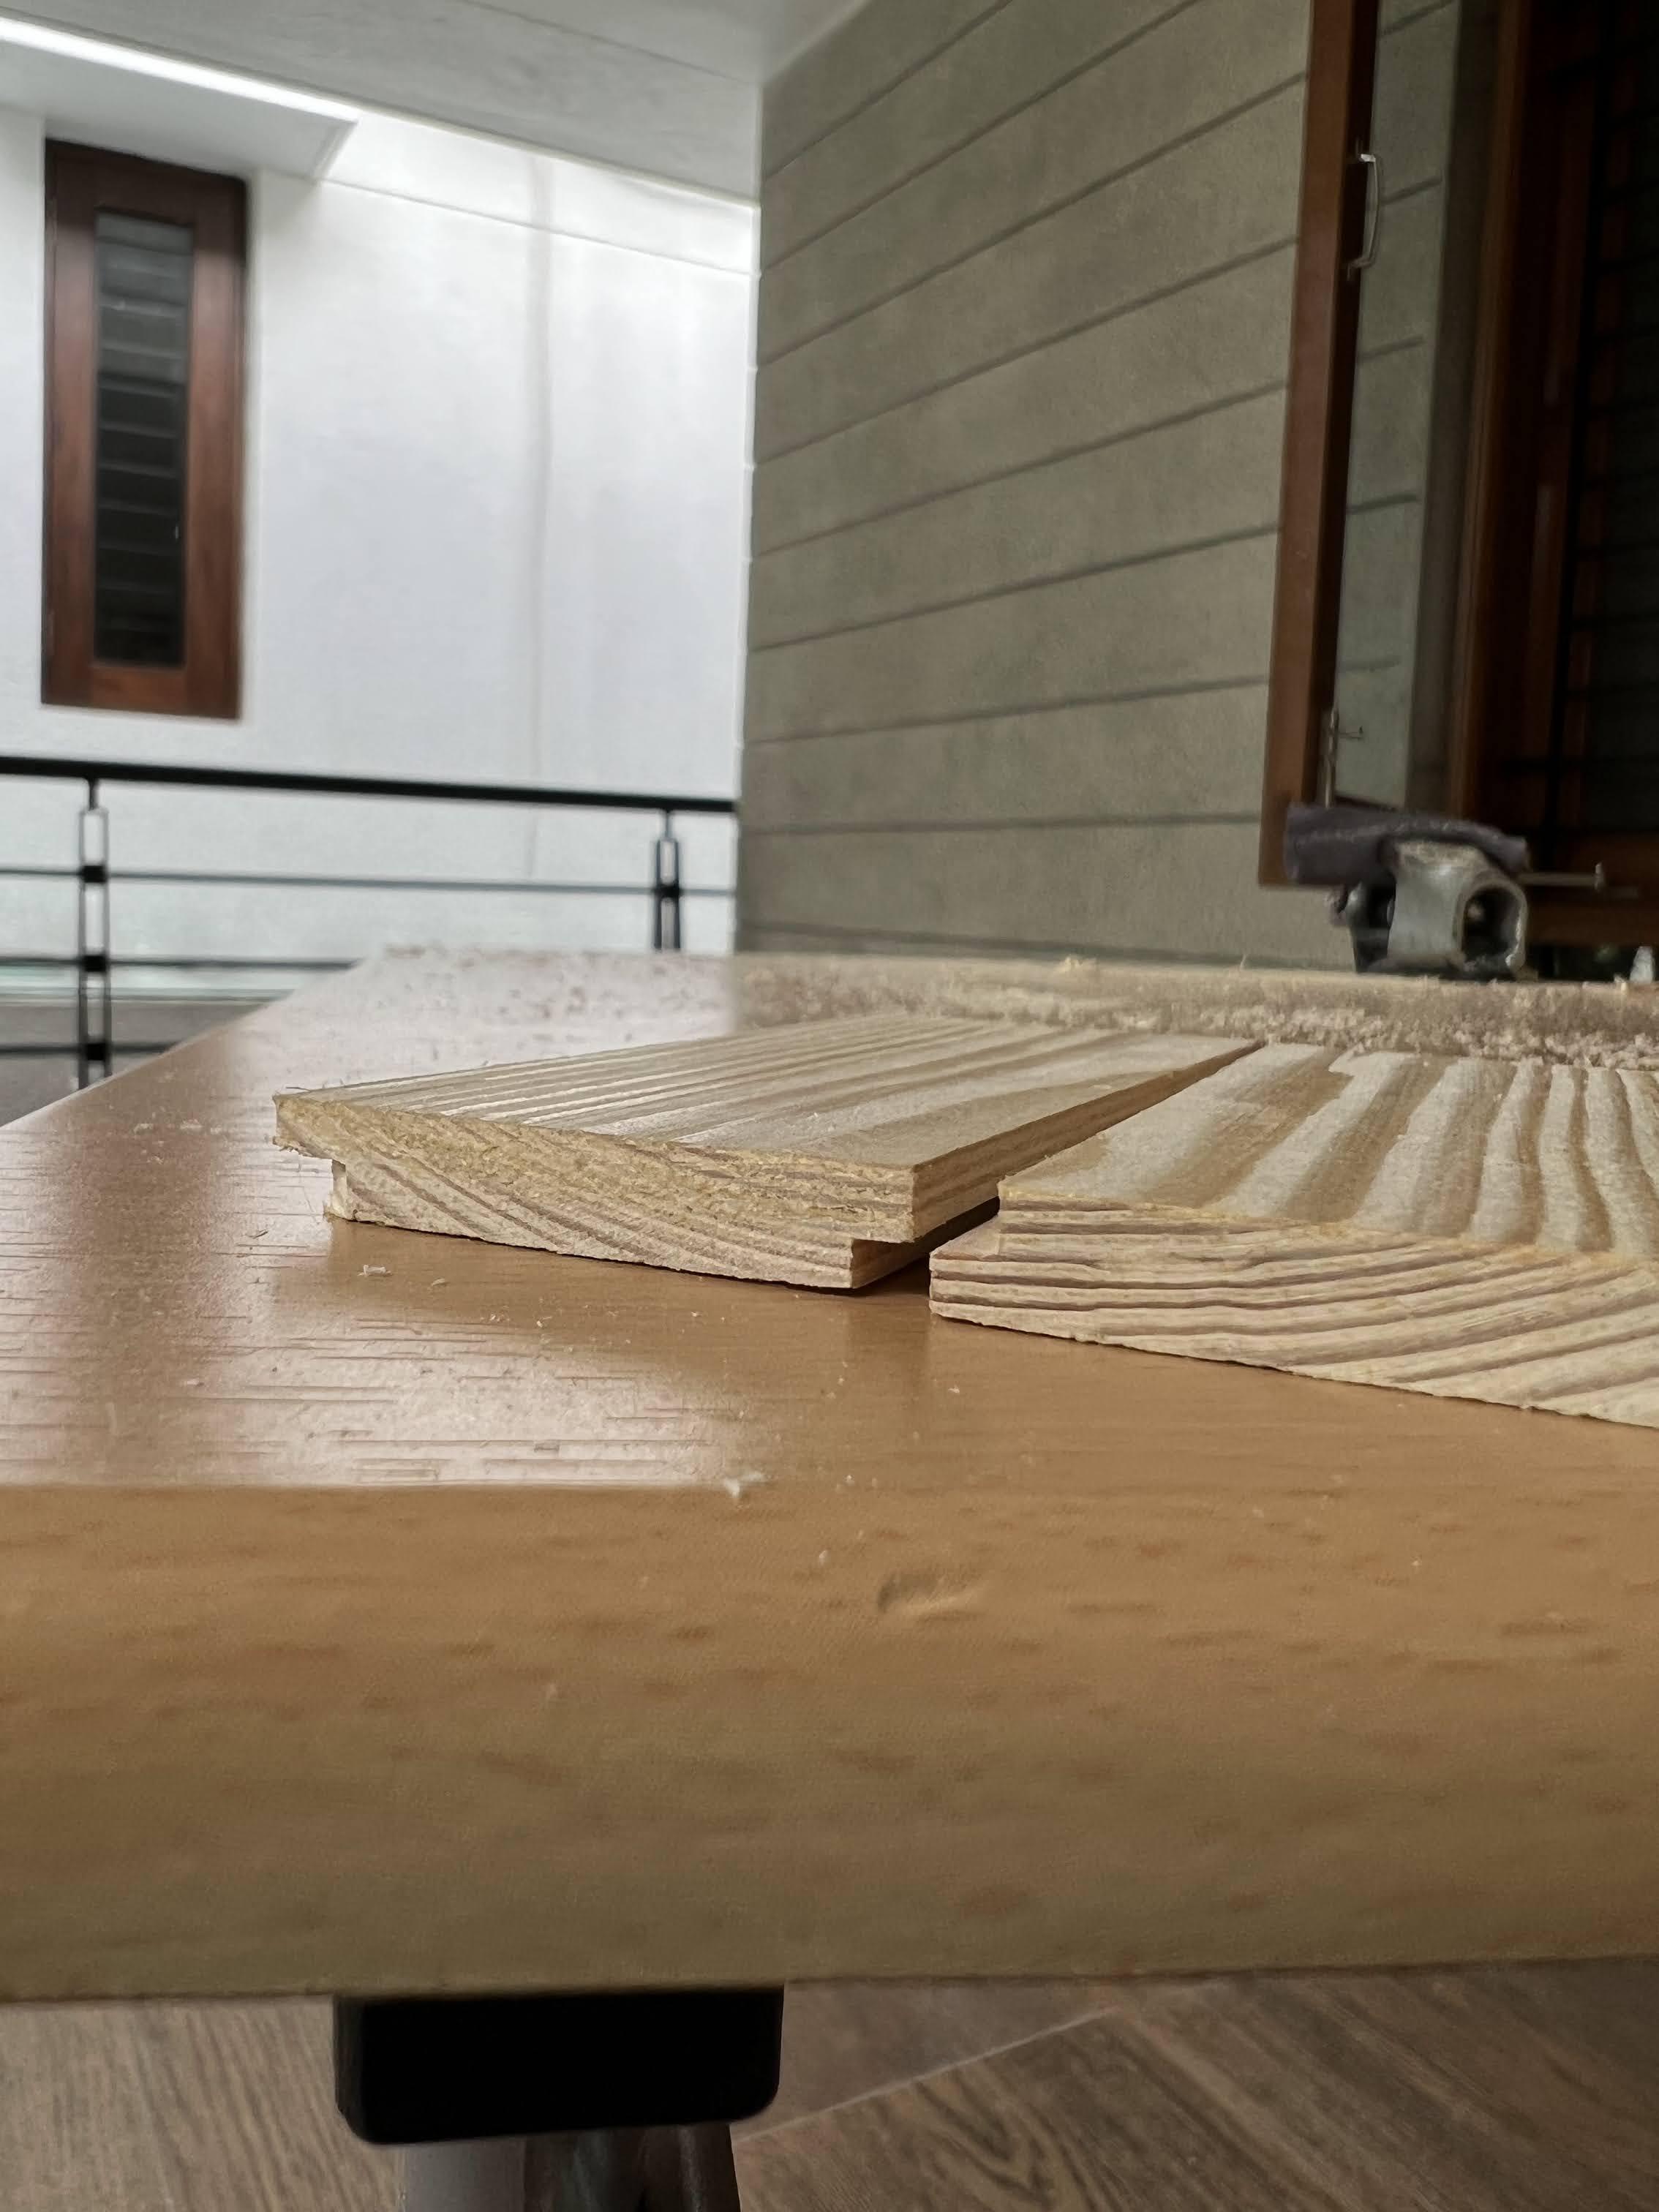
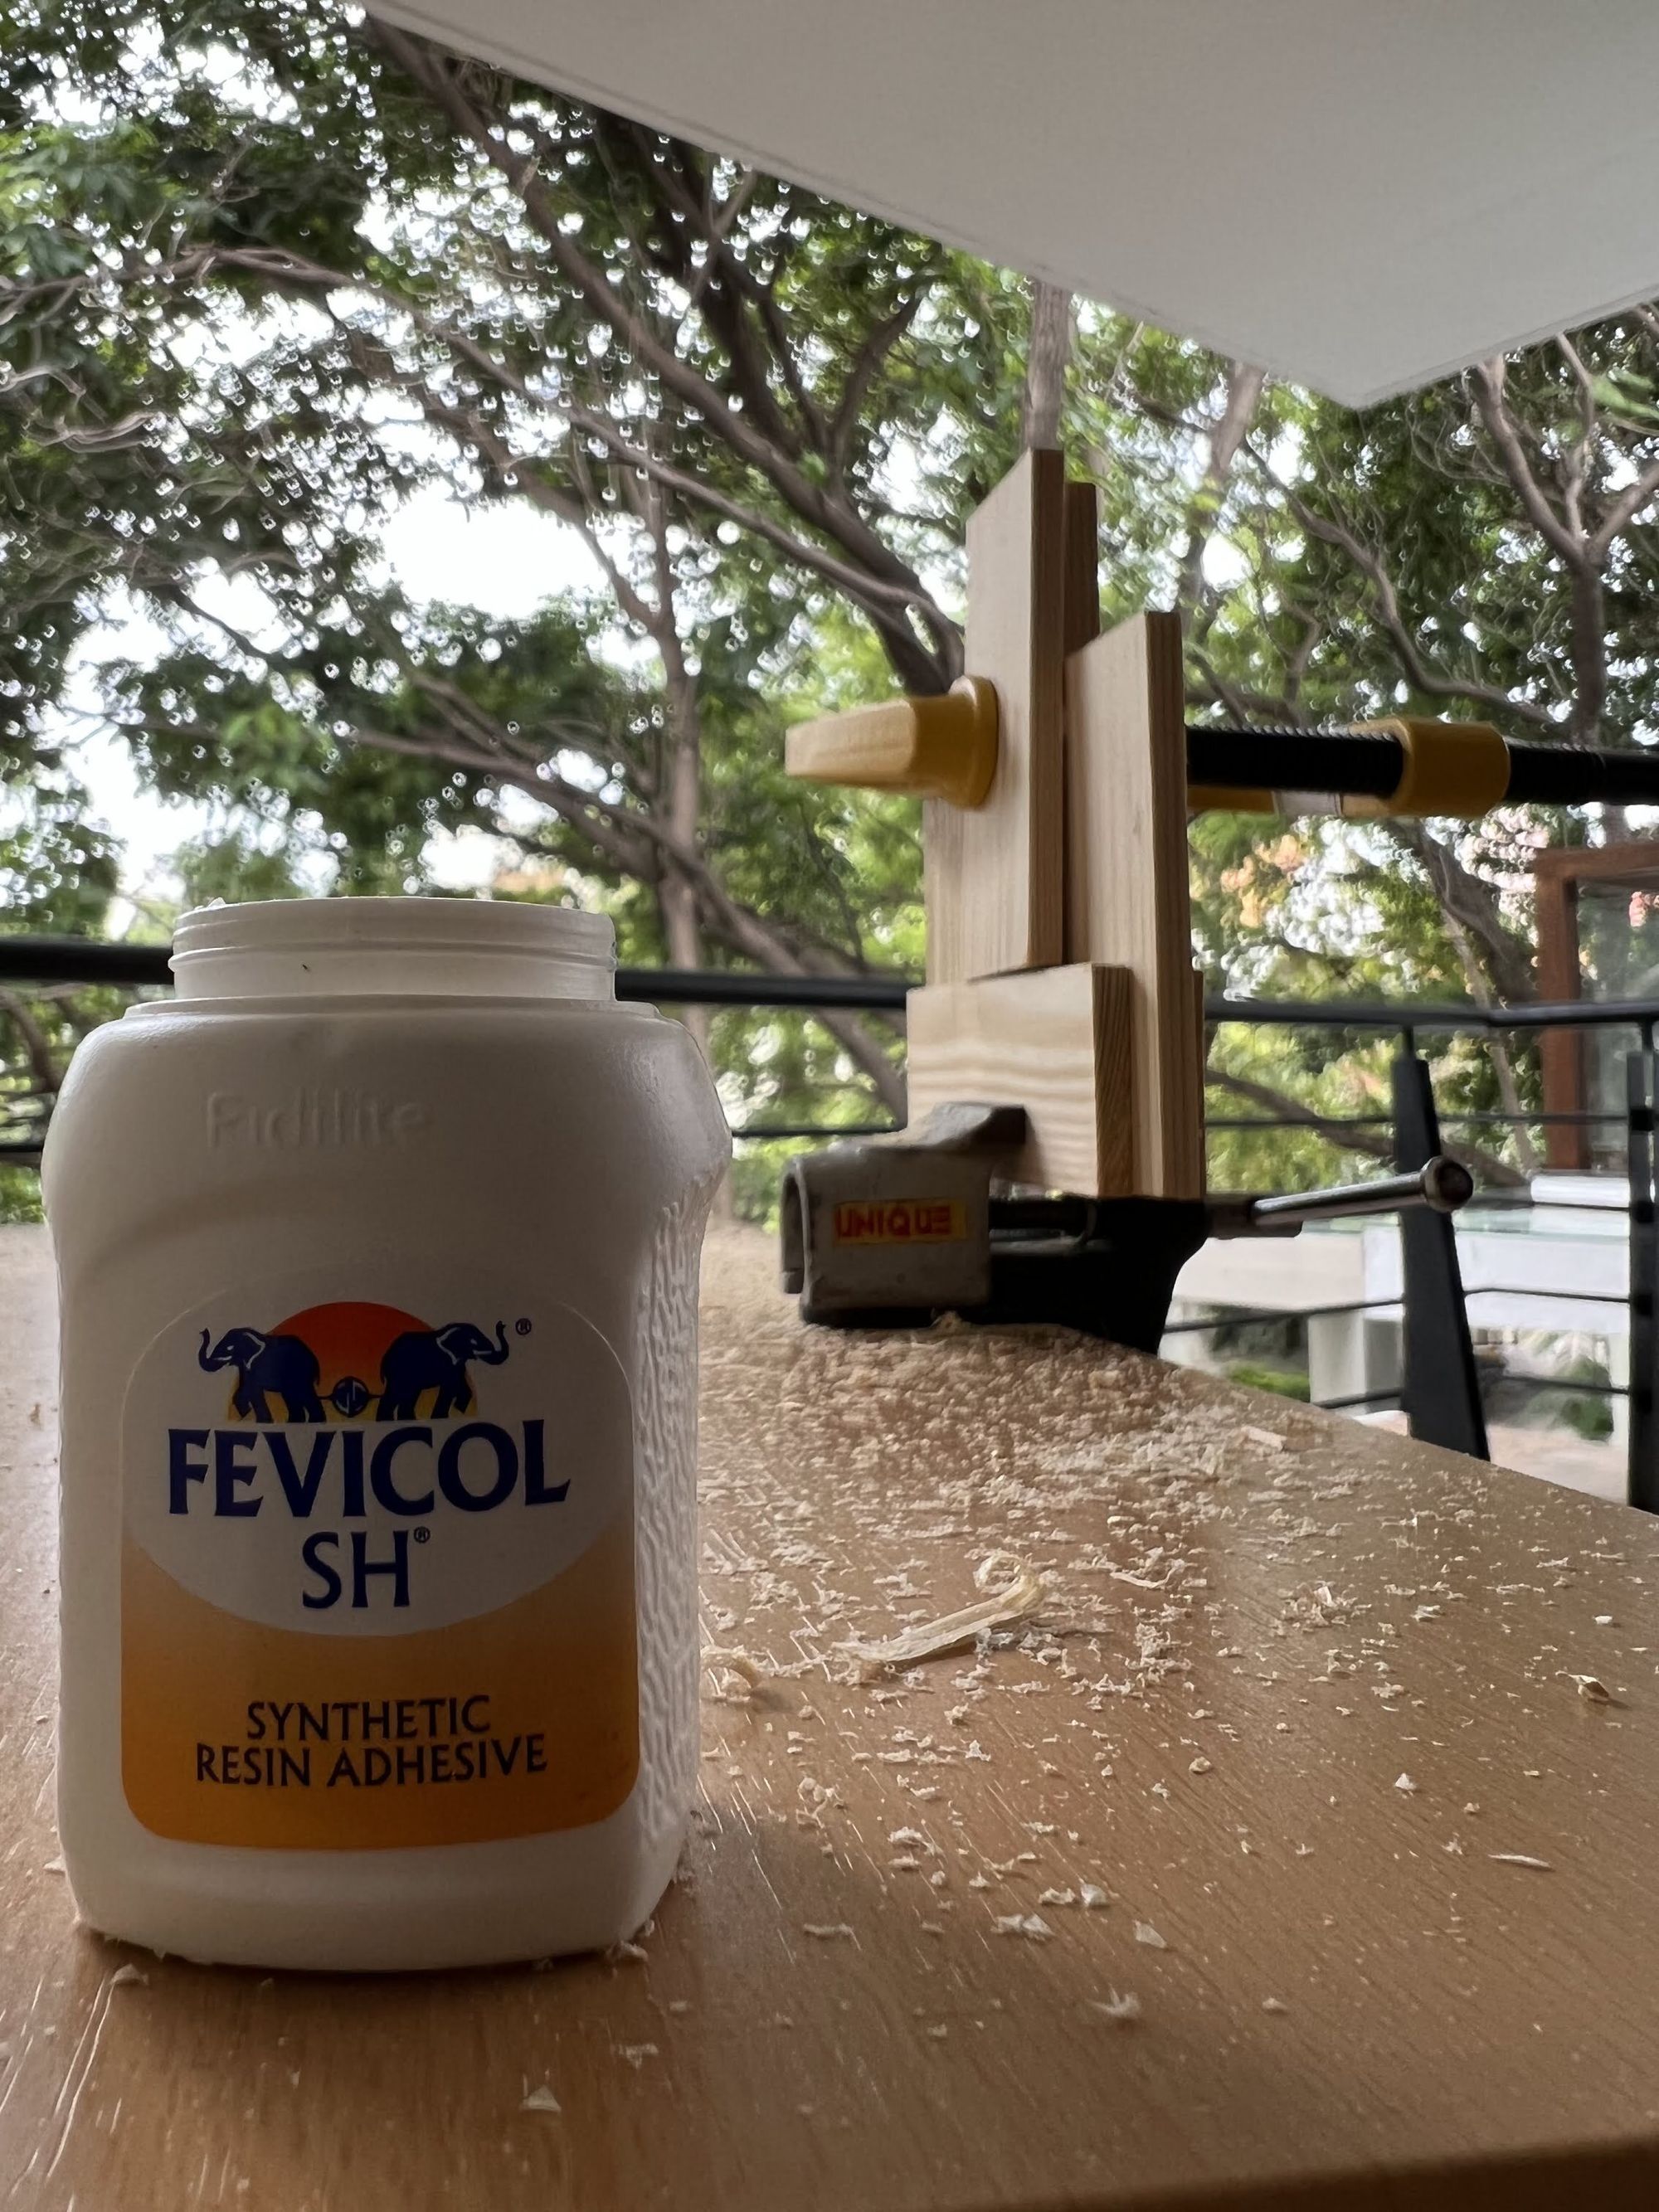
With the microcontroller code working as expected with the sensors, the piece that holds the hardware in place was missing. I cut a small section of wood and mounted the hardware onto it.
The next task at hand was to move this data somewhere.
ESPhome
Community driven Home Automation
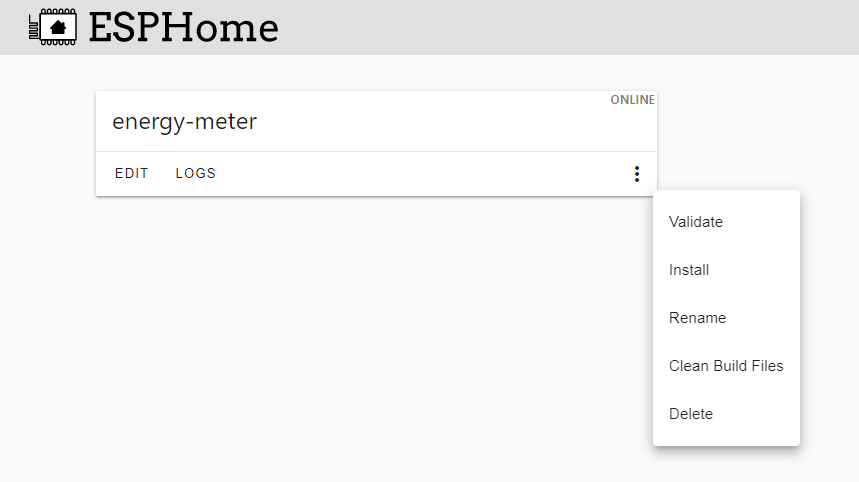
All this while, even after I'd heard of ESPhome, I would manually compile and push code into microcontrollers using my laptop. I finally got myself to try ESPHome. And OMG!
I can update the microcontroller wirelessly and on demand. Its like an OTA update for the board. Everything from logs, signal strengths, changing Wi-Fi SSID, ports or adding code in general could be done via a browser.
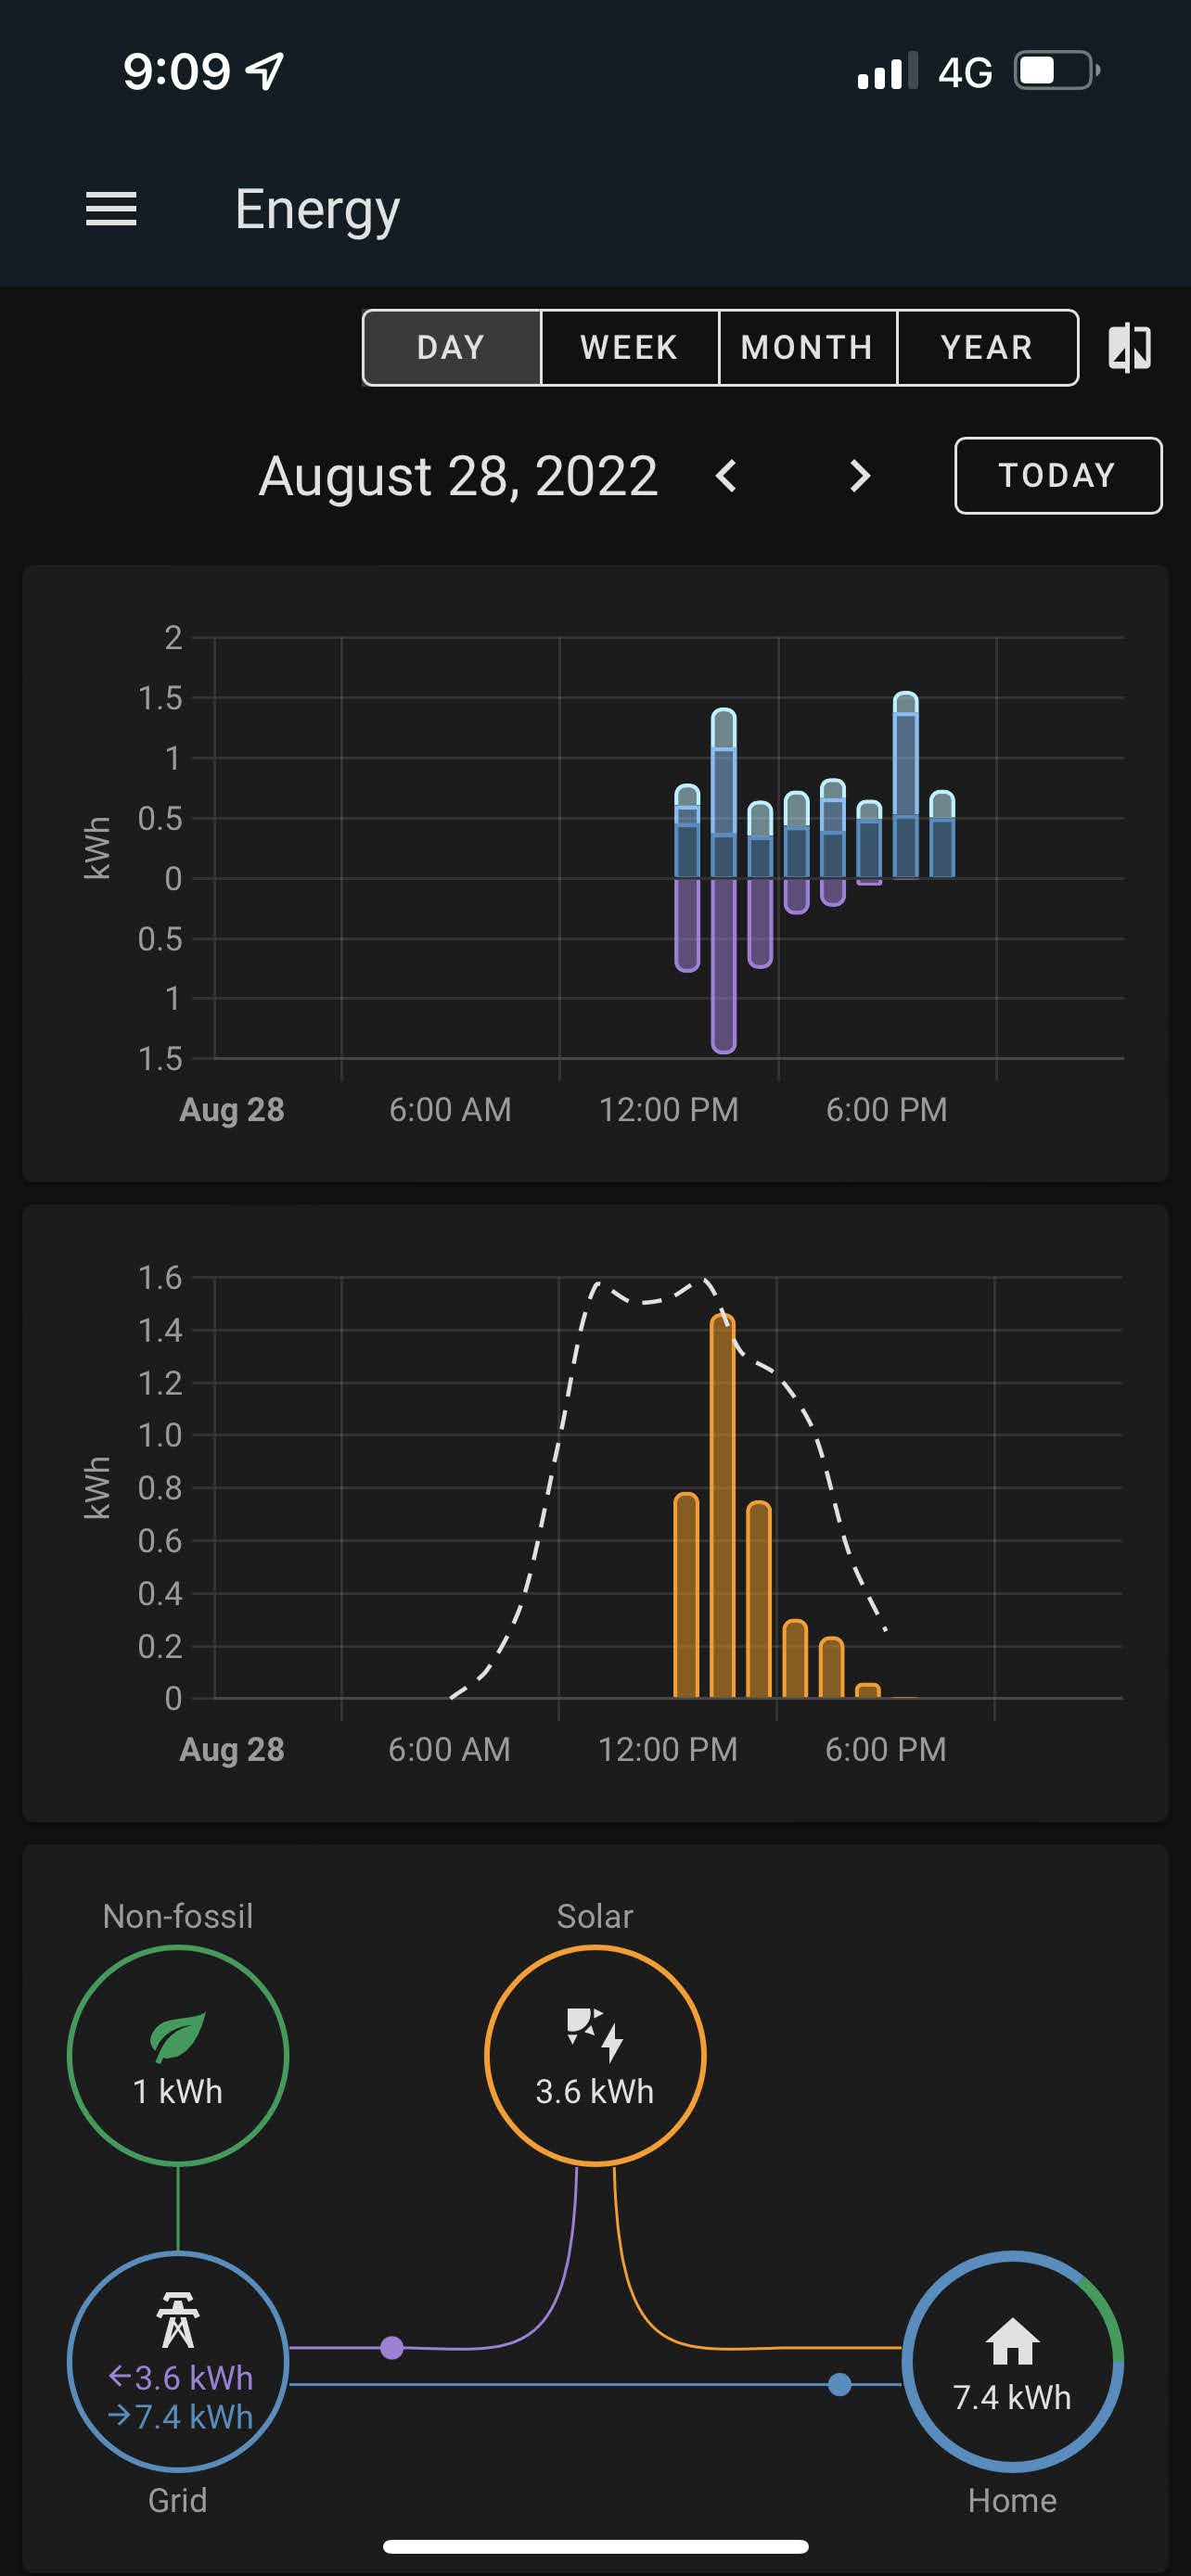
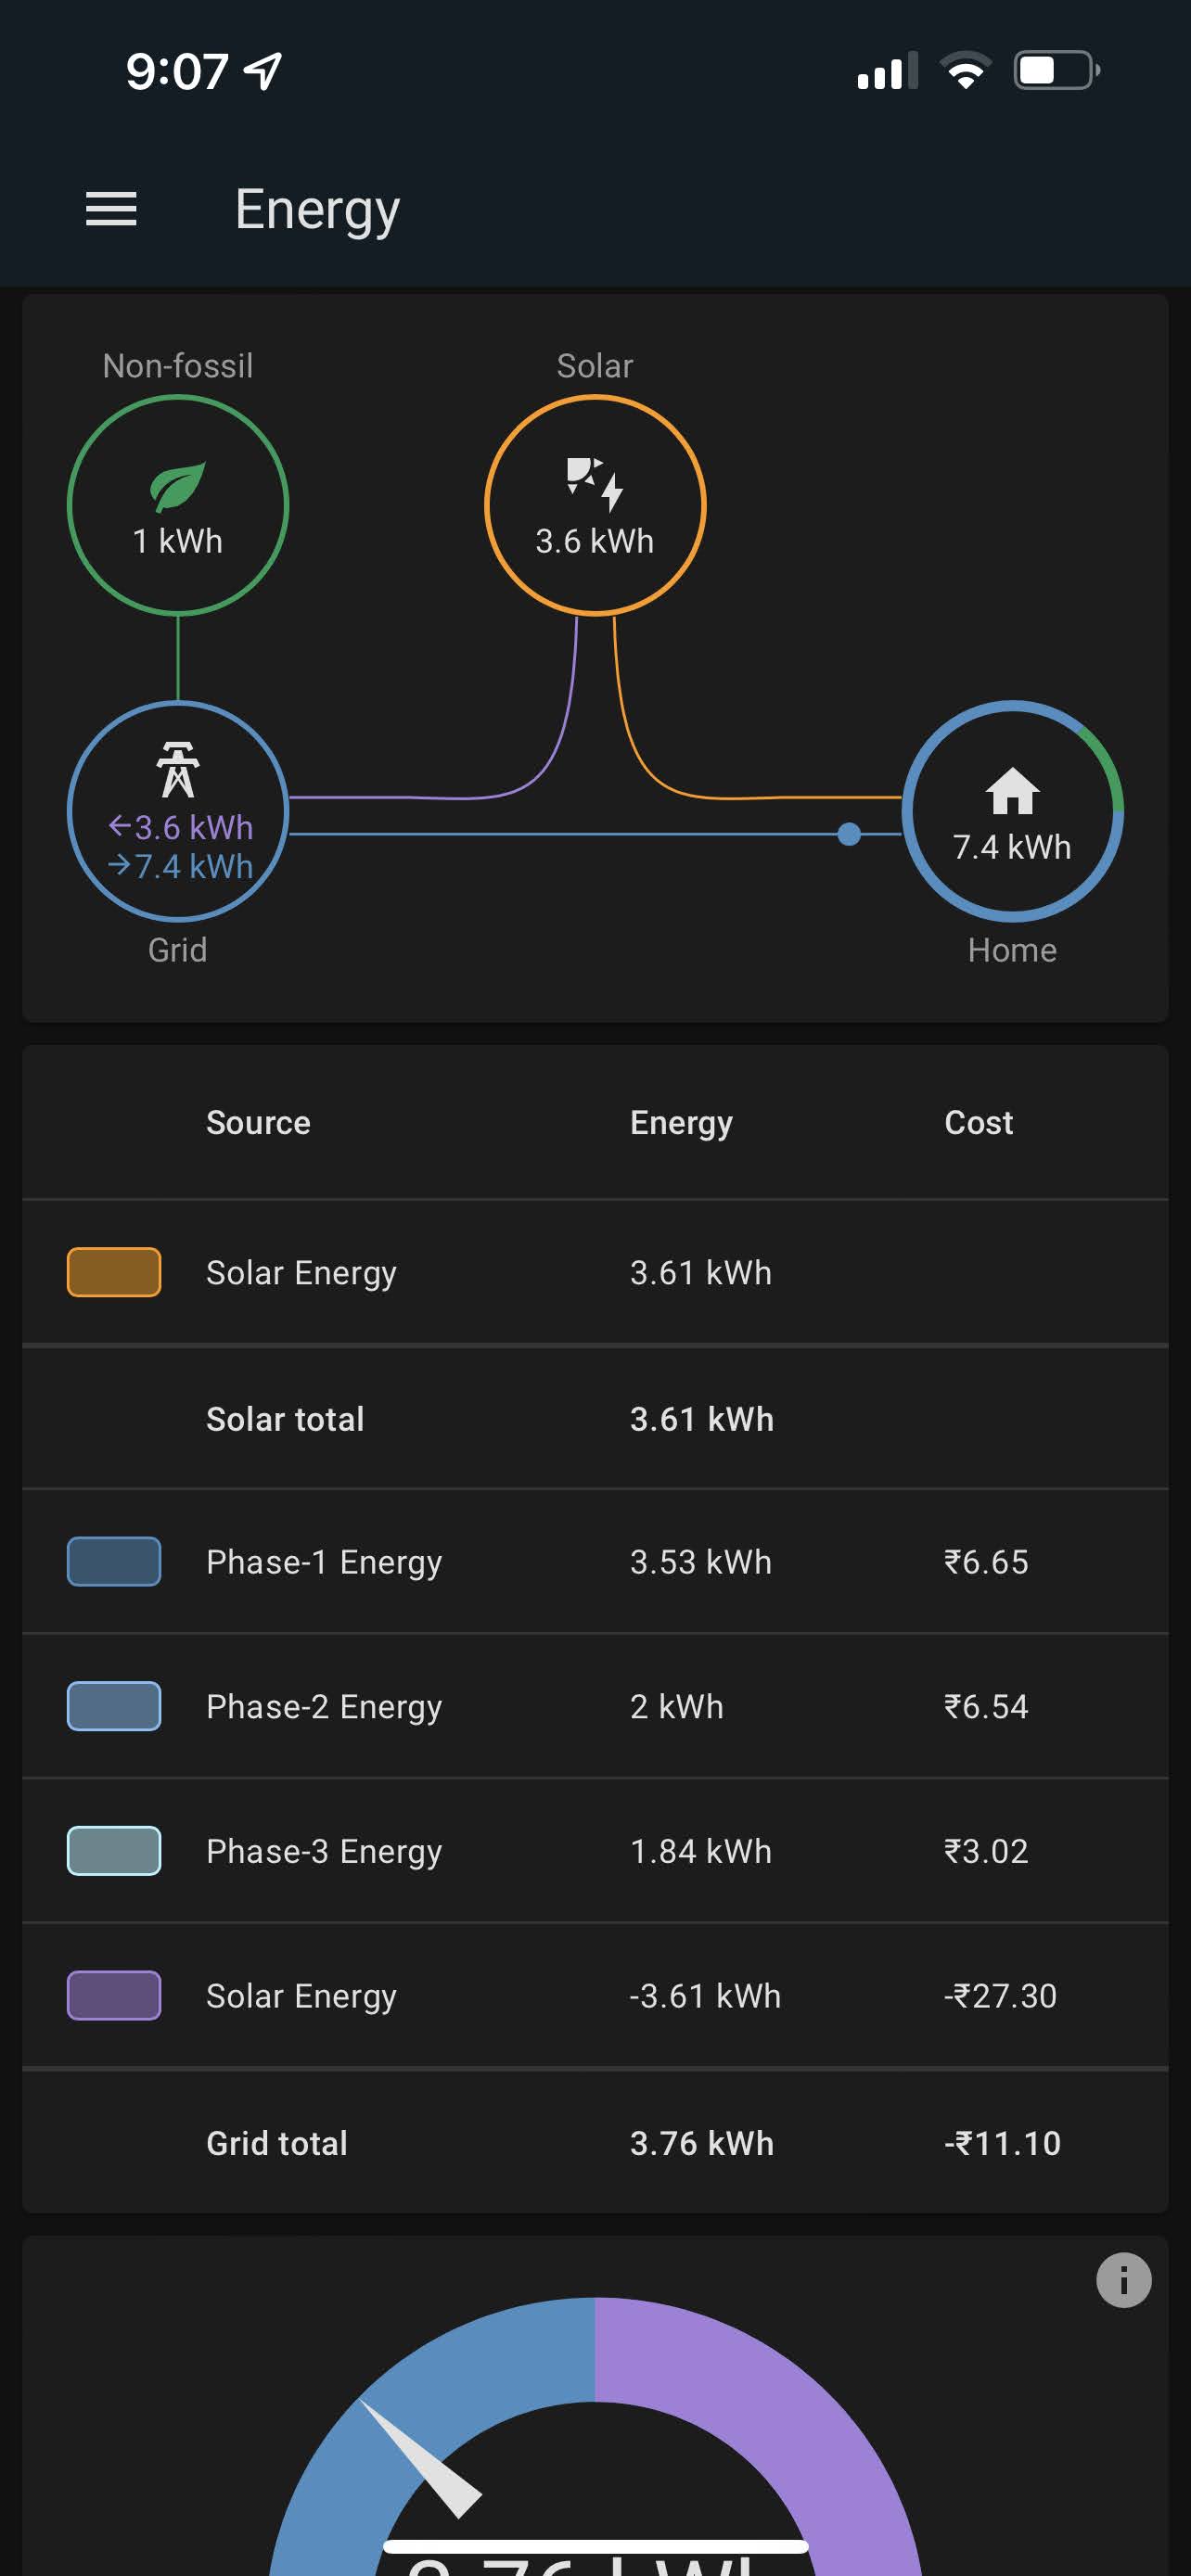
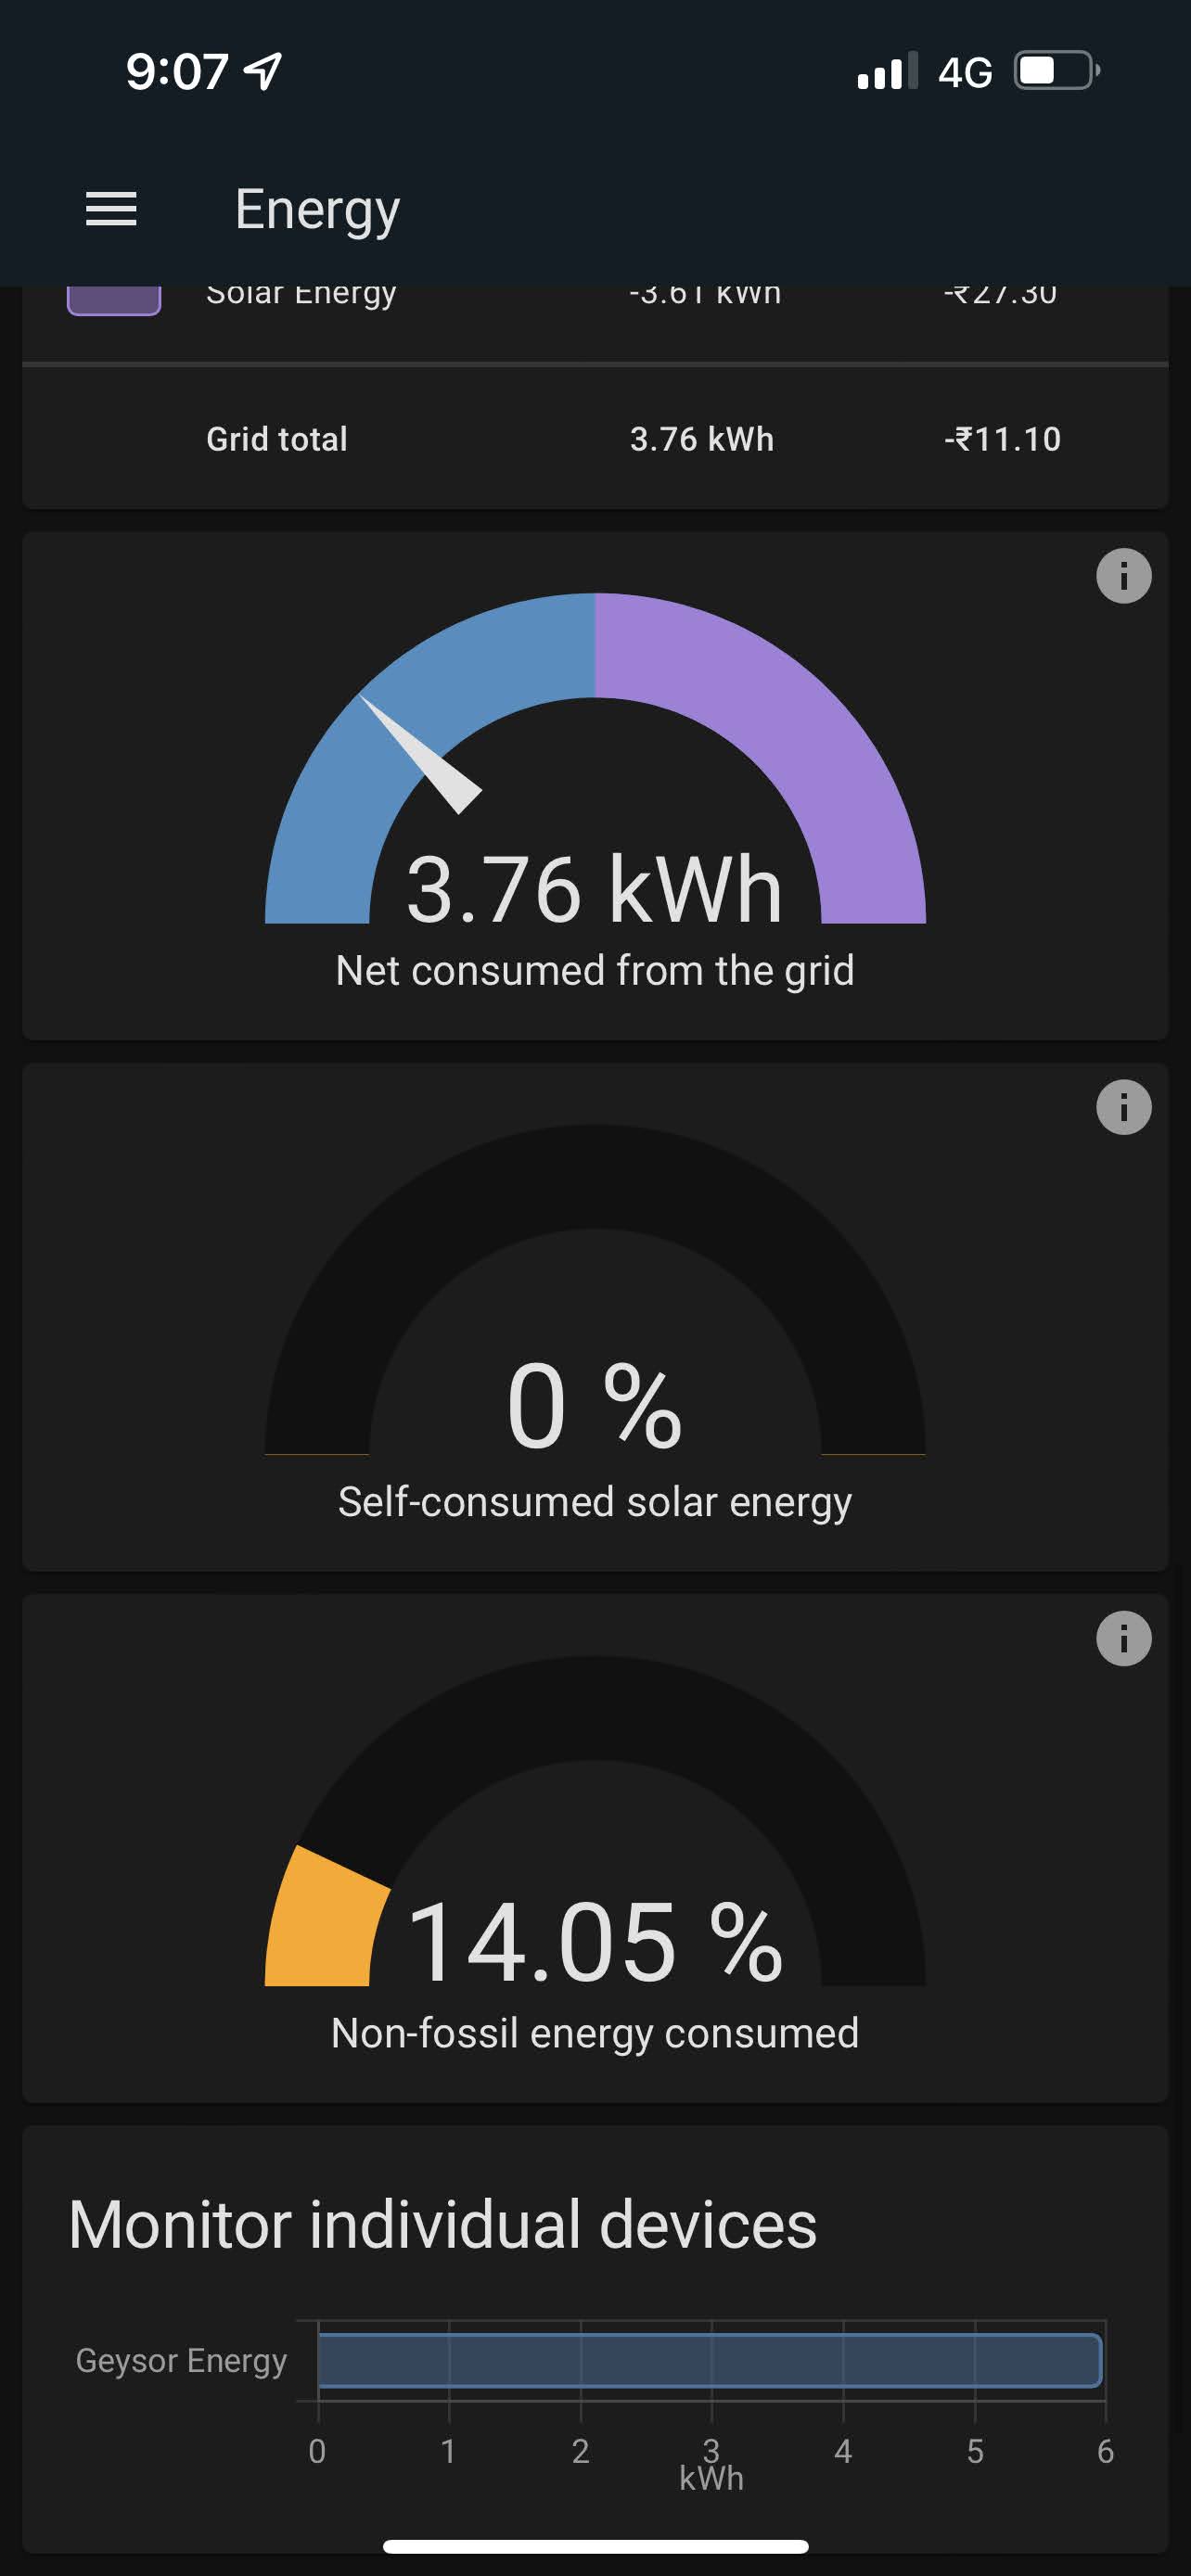
After I plugging the sensors into Home Assistant. I was presented with a masterpiece. I did leave out a few bits, like configuring the Riemann sum integral to calculate energy for appliances that only reported power. Trapezoidal rule of integration was a good read.
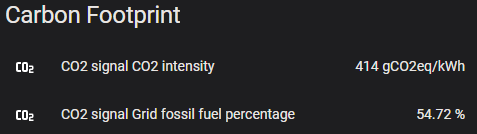
CO2 Signal is an integration that is available on Home Assistant. It gives details on your source of electricity.
Electrical Panel
Room for improvement perhaps?
With home assistant, I can now access these metrics from anywhere. Albeit, with an internet connection and a device. I can't stress the need to be careful, working with AC mains is not a joke. Do not take it lightly if you attempt to recreate this!
Getting Technical
Specifications
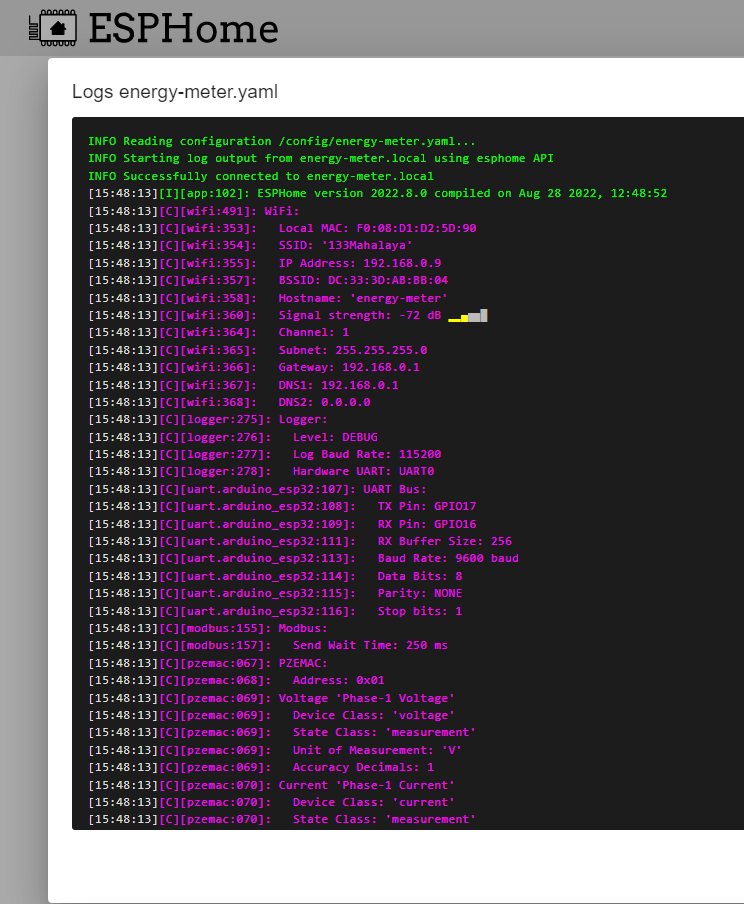
ESP32 using one hardware serial monitor in TTL serial network as master and connected sensors as slaves.
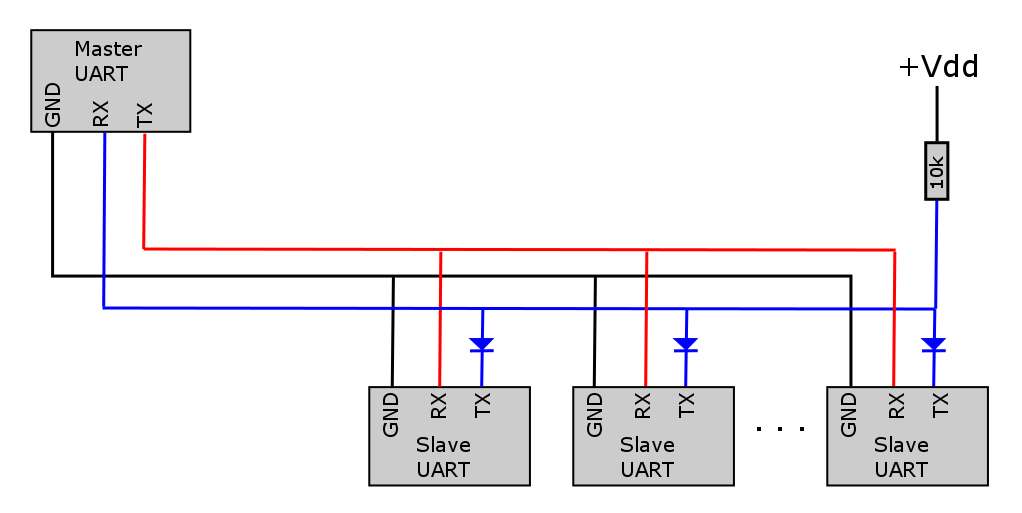
Each sensor was assigned a custom address that ranges between 0x01 and 0xF8. This is part of ModBus. With custom addresses, unique calls can be made from microcontroller to fetch reading. The PZEM-AC Library has all the necessary tools and example code.
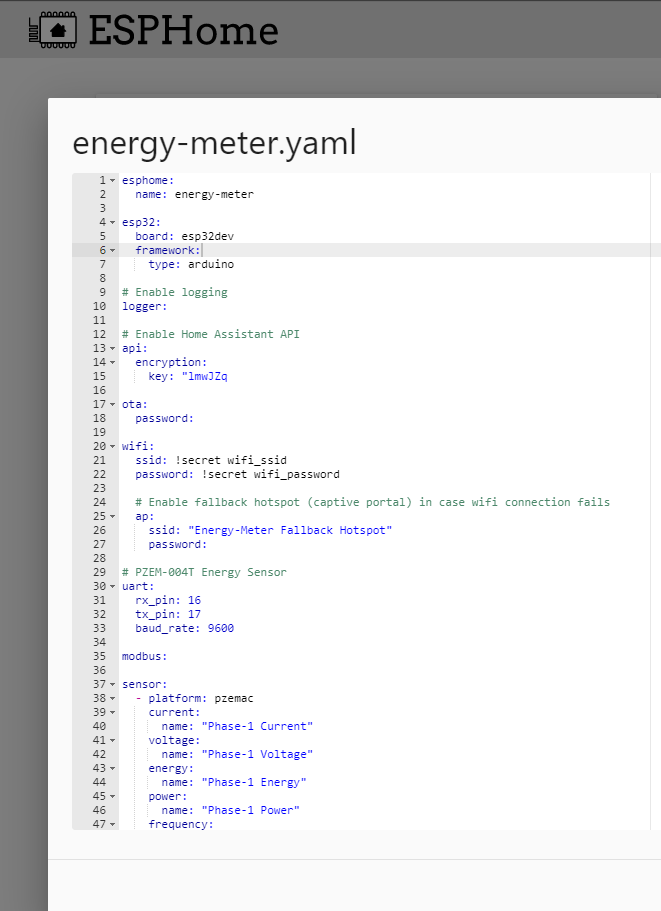
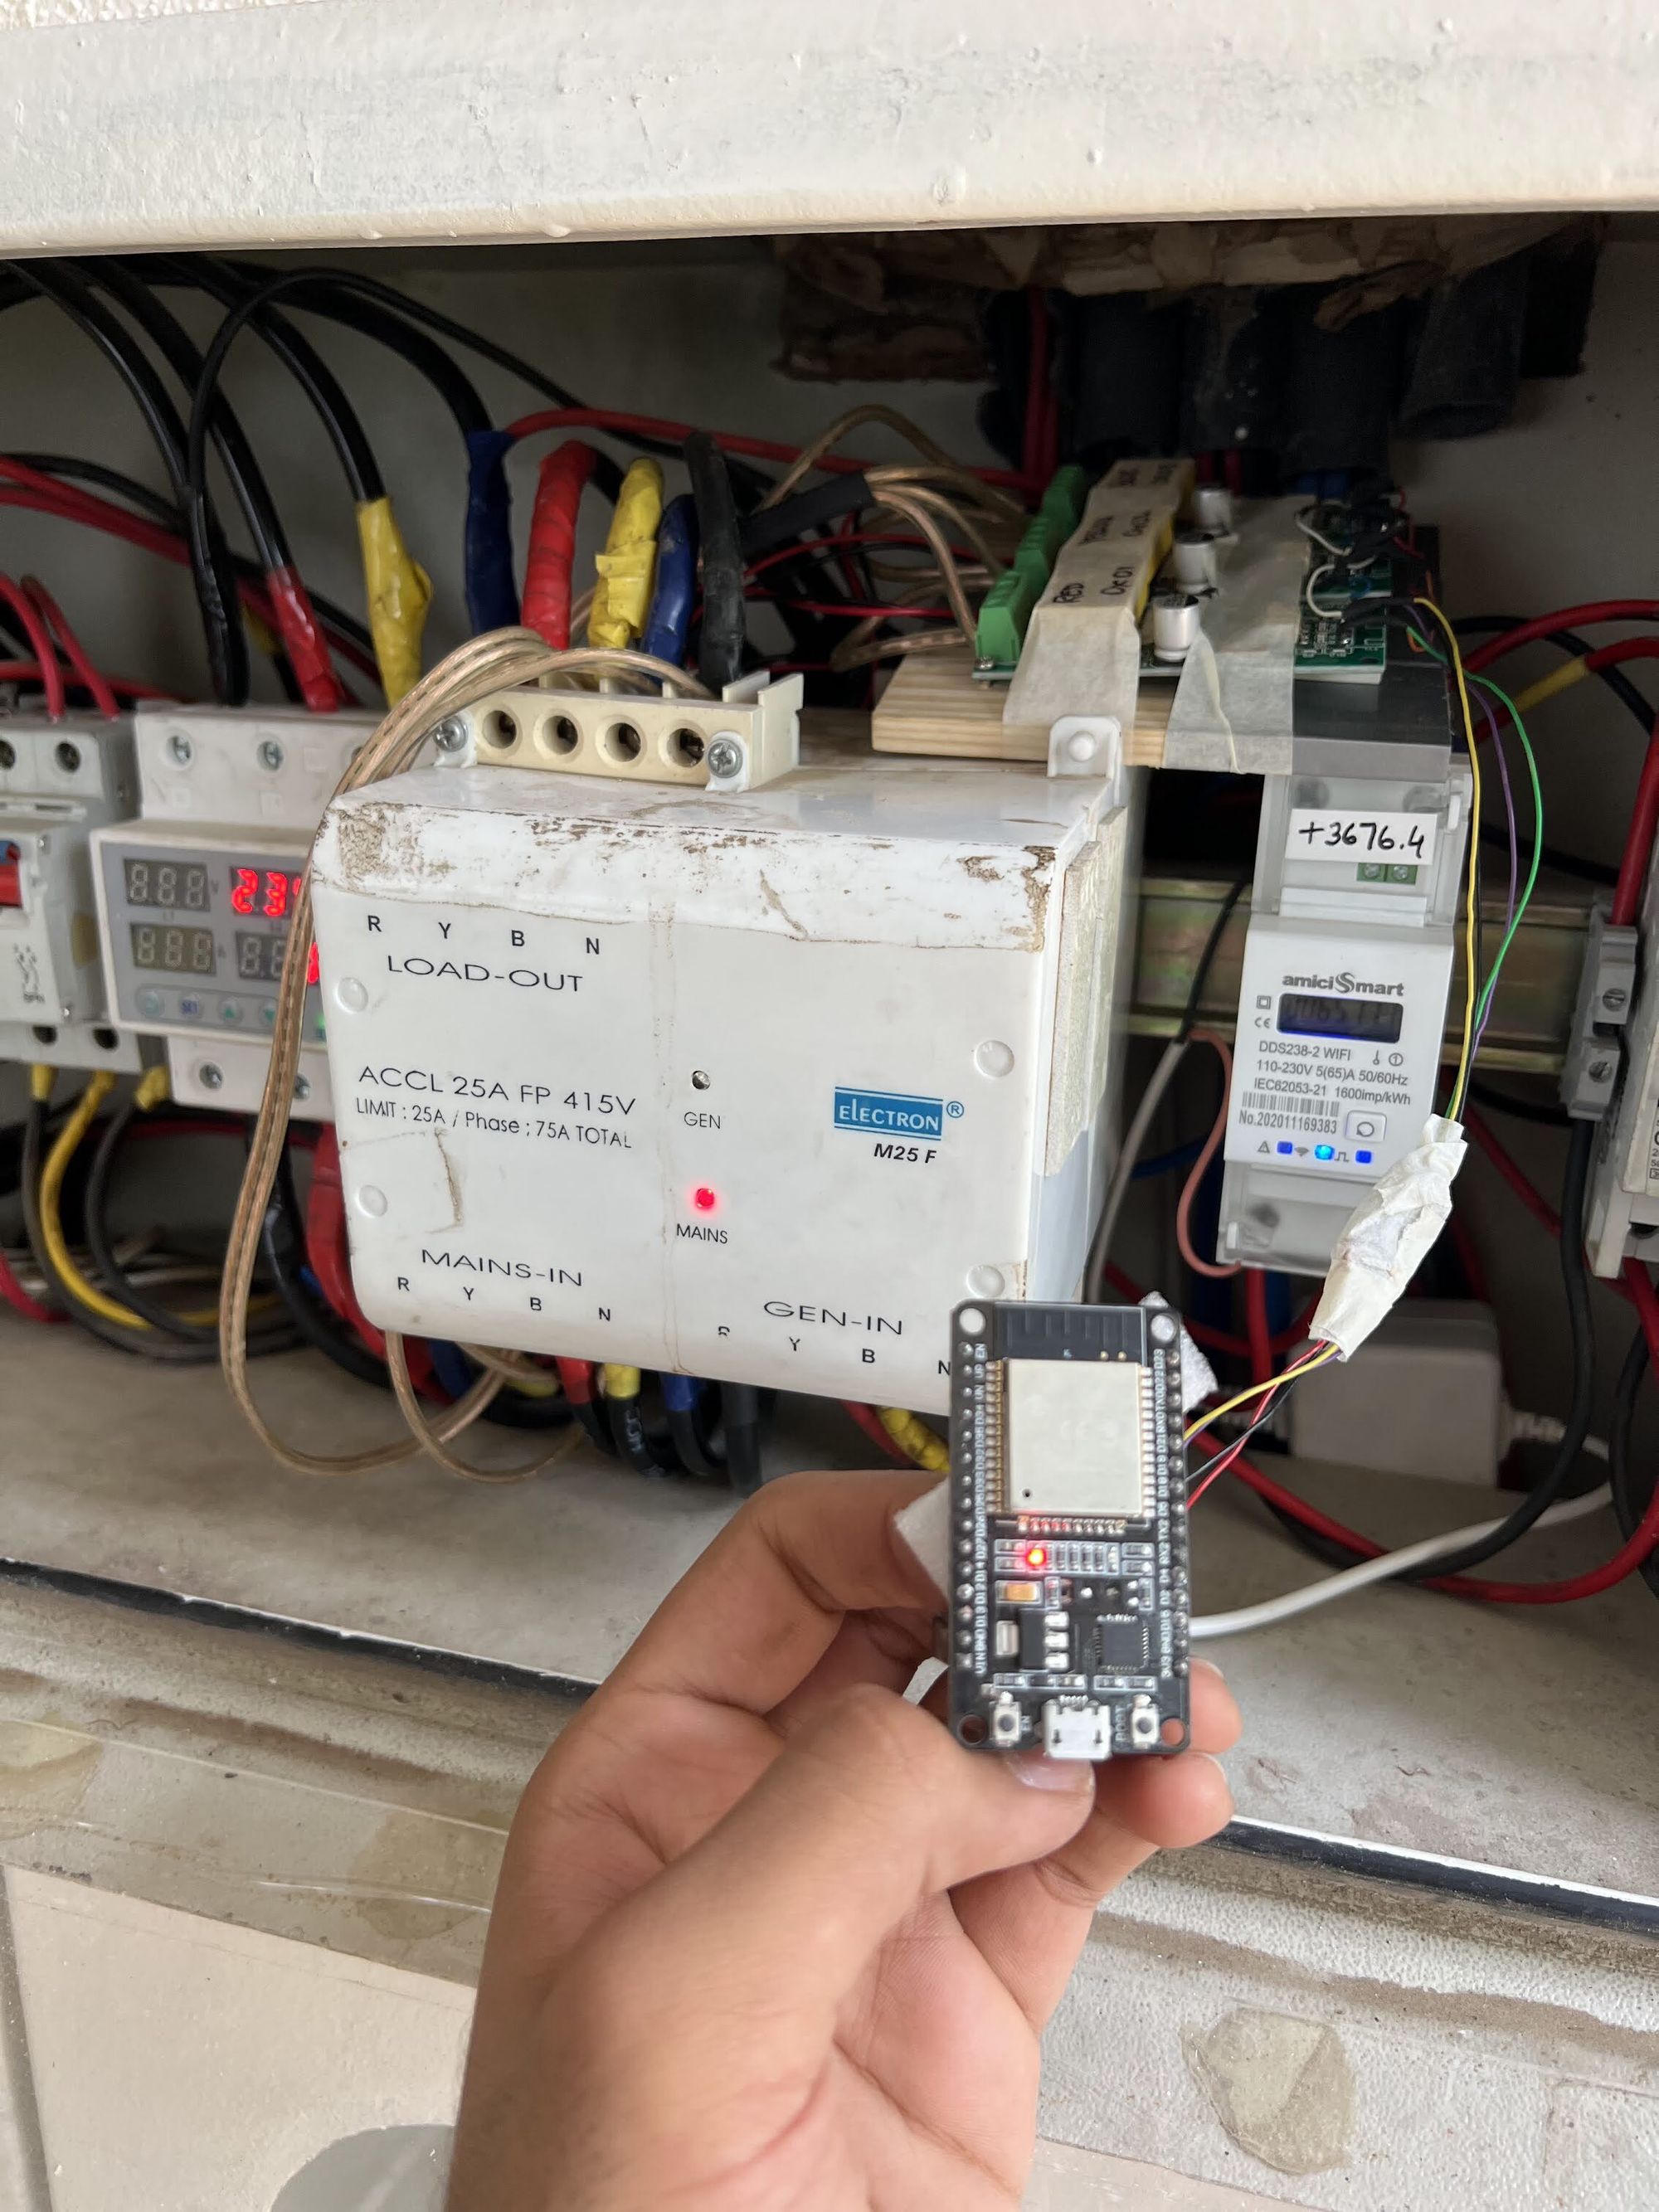
ESPhome was flashed onto the microcontroller and a yaml file with the required details was pushed. This setup was then deployed right after the electricity meter. Following the documentation on Home Assistant to add all the sources of electricity, it set up a dashboard and started recording. Forecasting was also available for the solar plant.
To make all the connections permanent and leave no room for loose contacts, I opted to solder and not use jumper cables.